


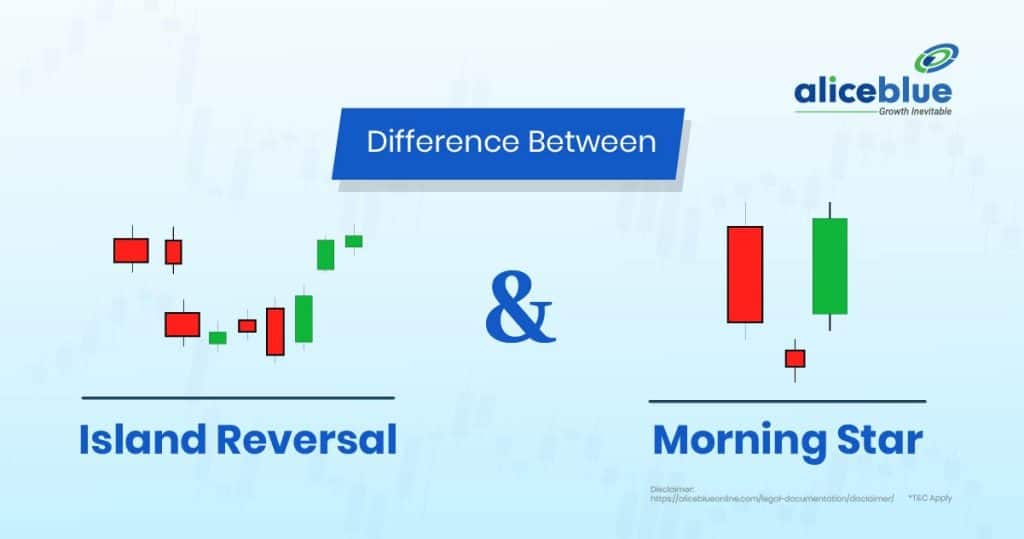
An Island Reversal signals a strong trend reversal with a price gap on both sides, indicating a shift in market sentiment. In contrast, a Morning Star is a three-candle bullish reversal pattern, where a small-bodied candle between a bearish and bullish candle confirms an uptrend continuation.
Content:
- What Is An Island Reversal?
- Island Reversal Example
- Morning Star Meaning
- Morning Star Example
- Difference Between Island Reversal And Morning Star
- How to Identify a Morning Star Pattern?
- How to Identify an Island Reversal Candlestick Pattern?
- Island Reversal Vs Morning Star – Quick Summary
- What Is The Difference Between An Island Reversal And A Morning Star Pattern?- FAQS
What Is An Island Reversal?

An Island Reversal is a strong trend reversal pattern that forms when the price gaps in one direction, consolidates briefly and then gaps in the opposite direction. This creates an isolated price cluster, signaling a shift in market sentiment and a potential trend reversal.
The gap formation on both sides separates the island from the previous trend, indicating a lack of liquidity in that range. Island Reversals can occur in both bullish and bearish markets, with a bullish Island Reversal signaling a move higher and a bearish Island Reversal indicating potential downside.

Island Reversal Example
An example of an Island Reversal occurs when a stock in a downtrend gaps lower, consolidates for a few sessions and then gaps up strongly, trapping short sellers. This confirms a bullish reversal, with prices surging as new buyers enter the market.
For instance, if a stock was trading at ₹500, gaps down to ₹480, consolidates and then gaps back up to ₹510, it creates an island formation. This signals a shift in trend, where selling pressure weakens and a new uptrend begins. Traders confirm it with volume spikes and technical indicators.
Morning Star Meaning

A Morning Star is a three-candle bullish reversal pattern that appears after a downtrend, signaling a potential trend reversal. It consists of a large bearish candle, a small-bodied candle (indecision) and a strong bullish candle, confirming a shift from bearish to bullish sentiment.
The pattern represents market indecision followed by a renewed buying interest. The middle candle is crucial, as it shows that the selling momentum is weakening. A Morning Star at support levels, along with rising volume, increases its reliability as a trend reversal indicator.
Morning Star Example
For example, a stock in a downtrend forms a large red candle at ₹200, followed by a small-bodied candle at ₹195, indicating hesitation. The next day, a strong green candle at ₹210 confirms the Morning Star, signaling a potential uptrend.
This pattern is significant when supported by high volume and other indicators like RSI and MACD crossovers. Traders look for additional confirmation before entering long positions, ensuring that the bullish momentum will sustain beyond the pattern formation.
Difference Between Island Reversal And Morning Star
An Island Reversal and a Morning Star are both reversal patterns, but they differ in structure. Island Reversal forms with price gaps on both sides, while Morning Star is a three-candle bullish reversal pattern confirming trend change when supported by volume and technical indicators.
| Aspect | Island Reversal | Morning Star |
| Pattern Structure | Formed by gaps on both sides, creating isolated price action. | A three-candle pattern with bearish, indecisive and bullish candles. |
| Reversal Strength | Stronger as it traps traders with sudden price gaps. | Requires confirmation through volume and indicators for reliability. |
| Occurrence | Found in both uptrends and downtrends, signaling reversal. | Appears at the end of a downtrend, signaling a bullish reversal. |
| Market Sentiment | Indicates a sharp shift in trend due to trapped traders. | Shows gradual trend change, where selling pressure weakens and buyers gain control. |
| Confirmation Needed | Needs high volume and breakout validation to confirm reversal. | Confirmed by a strong bullish third candle closing above the first candle’s midpoint. |
How to Identify a Morning Star Pattern?
A Morning Star pattern is identified by its three-candle formation, signaling a bullish trend reversal when confirmed with volume and technical indicators.
- Look for a Strong Bearish Candle
The first candle should be long and red, representing strong selling pressure before potential reversal. - Identify a Small or Indecisive Middle Candle
The second candle should be small-bodied, indicating market hesitation and weakening bearish momentum. - Confirm with a Strong Bullish Third Candle
The third candle should be long and green, closing above the first candle’s midpoint, confirming trend reversal. - Use Volume and Indicators for Confirmation
High trading volume, RSI divergence, or MACD crossovers strengthen the reliability of the Morning Star pattern.
How to Identify an Island Reversal Candlestick Pattern?
An Island Reversal is identified by a price gap in one direction, consolidation and a gap in the opposite direction, forming an isolated cluster.
- Observe a Price Gap in One Direction
The price gaps up or down, creating an initial trend shift with low liquidity in that range. - Look for a Period of Consolidation
The price stabilizes in a tight range, with neither buyers nor sellers taking control immediately. - Confirm with a Second Gap in the Opposite Direction
A gap in the opposite direction signals a trend reversal, forming an island separated from previous price action. - Validate with High Volume on Reversal Gap
Rising volume during the second gap confirms strong market participation, increasing the pattern’s reliability.
Island Reversal Vs Morning Star – Quick Summary
- An Island Reversal is a strong trend reversal pattern where the price gaps in one direction, consolidates briefly and then gaps in the opposite direction, leaving an isolated price cluster, signaling a shift in market sentiment. It can indicate bullish or bearish reversals.
- A Morning Star is a three-candle bullish reversal pattern that appears after a downtrend. It consists of a large bearish candle, a small-bodied candle (indecision) and a strong bullish candle, confirming a shift from bearish to bullish sentiment when validated by volume.
- A Morning Star is identified by its three-candle formation, where a strong bearish candle is followed by an indecisive small candle and then a bullish candle, confirming reversal when validated by high volume, RSI divergence, or MACD crossovers.
- An Island Reversal forms when a stock gaps in one direction, trades within a tight range and then gaps in the opposite direction. This isolated cluster signals a trend reversal when confirmed by high volume and strong momentum indicators.
- Open a free demat account with Alice Blue in 15 minutes today! Invest in Stocks, Mutual Funds, Bonds & IPOs for Free. Also, trade at just ₹ 20/order brokerage on every order.

What Is The Difference Between An Island Reversal And A Morning Star Pattern?- FAQS
1. What Is The Difference Between An Island Reversal And A Morning Star Pattern?
An Island Reversal forms with gaps on both sides, isolating price action, while a Morning Star is a three-candle bullish reversal pattern with a bearish, indecisive and bullish candle confirming trend reversal.
2. How To Use Morning Star And Island Reversal For Swing Trading?
Swing traders enter long positions after a Morning Star confirmation or an Island Reversal breakout, using volume, RSI and moving averages to confirm trend strength and place stop-loss orders strategically.
3. How Does An Island Reversal Pattern Work?
An Island Reversal works by forming a gap-down or gap-up, followed by a consolidation phase and then another gap in the opposite direction, signaling a strong trend reversal in price action.
4. What Does A Morning Star Pattern Indicate?
A Morning Star pattern signals a bullish reversal, where buying pressure overcomes selling momentum, leading to trend reversal, confirmed with a strong third bullish candle and rising volume.
5. Which Pattern Is More Reliable, Island Reversal Or Morning Star?
An Island Reversal is often stronger as it forms with gaps, trapping traders. A Morning Star is reliable but requires confirmation from volume and technical indicators before executing trades.
6. How Do Traders Use The Island Reversal Pattern?
Traders use Island Reversals by entering long or short trades after confirmation, setting stop-loss levels near the gaps and validating trades with RSI, MACD and volume spikes.
7. How Do Traders Confirm A Morning Star Pattern?
Traders confirm a Morning Star with high trading volume, a bullish close above the previous resistance and support from RSI divergence, MACD crossovers, or moving average confirmation.
8. Can An Island Reversal Be Bullish And Bearish?
Yes, an Island Reversal can be bullish when it gaps down and reverses upward or bearish when it gaps up and then reverses downward, depending on market conditions.
9. What Indicators Can Be Used With Island Reversal And Morning Star Patterns?
Traders use RSI, MACD, Bollinger Bands, moving averages and volume spikes to confirm Morning Star and Island Reversal patterns, ensuring higher accuracy in predicting trend reversals.
We hope you’re clear on the topic, but there’s more to explore in stocks, commodities, mutual funds, and related areas. Here are important topics to learn about.
Disclaimer: The above article is written for educational purposes and the companies’ data mentioned in the article may change with respect to time The securities quoted are exemplary and are not recommendatory.





