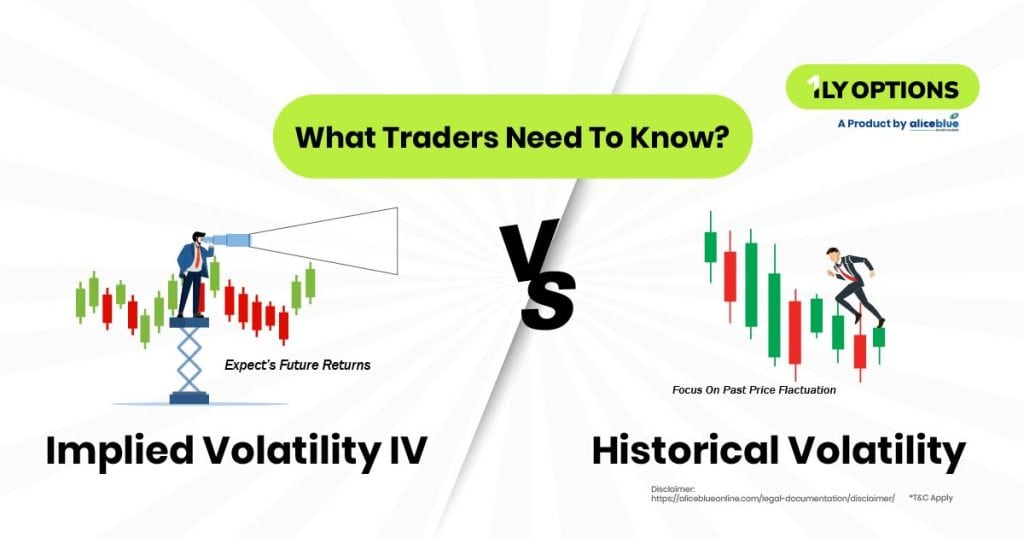
The main difference between implied volatility and historical volatility is that implied volatility (IV) forecasts future price fluctuations based on market expectations, while historical volatility (HV) measures past price movements. With 1lyOptions, traders can track IV and HV trends to optimize strategies and maximize profitability.
Content:
- What Is Volatility In Financial Markets?
- What Is Implied Volatility?
- What Is Historical Volatility?
- Implied Volatility Vs Historical Volatility
- How Do You Calculate Implied Volatility?
- How Do You Calculate Historical Volatility?
- How Analysing Implied Volatility and Historical Volatility Is Easy With 1LYoption Analytics Platform?
- When To Use Historical Vs Implied Volatility?
- How to Use Implied and Historical Volatility Together for Better Trades with 1LY Options
- Difference Between Historical Volatility And Implied Volatility – Quick Summary
- Implied Volatility Vs Historical Volatility – FAQs
What Is Volatility In Financial Markets?
Volatility in financial markets refers to the degree of price fluctuations over a given period. It measures how fast and unpredictably an asset’s price moves. High volatility indicates larger price swings, while low volatility signals stability, affecting risk levels and investment strategies.
Market volatility is influenced by factors such as economic events, geopolitical developments and investor sentiment. A rise in uncertainty can cause higher volatility, leading to increased price fluctuations and trading opportunities for short-term investors and options traders.
Traders use volatility indicators like Bollinger Bands, Average True Range (ATR) and the Volatility Index (VIX) to assess market conditions. Understanding volatility helps in risk management, strategic asset allocation and optimizing entry and exit points in trades.
What Is Implied Volatility?
Implied volatility (IV) estimates future price fluctuations based on market expectations. It is derived from options pricing and reflects anticipated movements rather than past performance. Higher IV suggests greater uncertainty, raising option premiums, while lower IV signals stability, reducing contract costs.
IV is influenced by factors such as earnings reports, economic indicators and major news events. It impacts both call and put options equally, affecting pricing strategies and risk management techniques for traders using options contracts.
Traders use IV to determine fair option pricing, execute volatility-based strategies and manage risk. By tracking IV trends, traders can identify whether an option is overpriced or underpriced, helping them optimize trades for maximum profitability.

What Is Historical Volatility?
Historical volatility (HV) measures past price fluctuations over a specific timeframe. Unlike implied volatility, which forecasts future movement, HV calculates the actual price variance of an asset, providing insights into past market behaviour and risk levels.
HV is determined using statistical calculations such as standard deviation over a set period. A higher HV indicates frequent and large price swings, while a lower HV reflects a more stable asset with minimal fluctuations in value.
Traders compare HV with IV to assess market expectations versus reality. When IV is significantly higher than HV, options may be overpriced, presenting opportunities for selling strategies. If IV is lower, buying options could be more favourable.
Implied Volatility Vs Historical Volatility
The main difference between implied volatility and historical volatility is that implied volatility (IV) predicts future price fluctuations based on market expectations, while historical volatility (HV) measures past price movements. Traders compare both to assess market trends, optimize strategies and manage risk effectively.
| Feature | Implied Volatility (IV) | Historical Volatility (HV) |
| Definition | Predicts future price fluctuations based on market expectations. | Measures past price movements over a specific period. |
| Calculation Basis | Derived from option pricing models like Black-Scholes. | Calculated using the standard deviation of past asset prices. |
| Market Influence | Affected by demand for options, market sentiment and economic events. | Influenced by past price swings, trading volume and historical trends. |
| Impact on Options | Higher IV increases option premiums, while lower IV makes options cheaper. | HV helps assess past risks but does not impact current option prices directly. |
| Trading Application | Used to anticipate price movements and adjust strategies. | Used to compare past volatility with IV to find mispriced options. |
| Timeframe | Forward-looking, based on expectations. | Backward-looking, based on actual price data. |
How Do You Calculate Implied Volatility?
Implied volatility is calculated using an options pricing model like the Black-Scholes formula. It is derived from an option’s market price, factoring in strike price, expiration, interest rates and expected future fluctuations to estimate the probability of price changes.
Since IV is not directly observable, traders use pricing models to determine it based on the current price of options contracts. Higher demand for options increases IV, while lower demand decreases IV, impacting overall pricing strategies.
How Do You Calculate Historical Volatility?
Historical volatility is calculated by measuring an asset’s past price movements using standard deviation. It involves taking the average of past price changes over a selected period and determining the degree of variation from the mean price.
The formula involves finding the asset’s daily returns, computing the average return and determining the standard deviation of those returns. A higher standard deviation indicates higher HV, signalling increased risk and potential price swings.
Traders use HV to compare past market movements with current implied volatility. This helps in identifying discrepancies in pricing, allowing traders to adjust their strategies by either selling expensive options in high IV periods or buying cheaper ones when IV is low.
How Analysing Implied Volatility and Historical Volatility Is Easy With 1LYoption Analytics Platform?
Analyzing implied and historical volatility is seamless with 1lyOptions, offering real-time IV tracking, historical volatility comparisons and predictive analytics. The platform helps traders assess volatility trends, identify mispriced options and execute well-informed strategies to maximize profits in dynamic market conditions.
The analytics platform provides volatility indicators which enable traders to compare IV with HV efficiently. By identifying deviations between expected and actual price movements, traders can pinpoint potential trade opportunities and adjust their positions accordingly.
When To Use Historical Vs Implied Volatility?
The main difference in using historical vs. implied volatility is that historical volatility helps analyze past price fluctuations, while implied volatility predicts future movements. Traders use historical volatility for trend analysis and risk assessment, while implied volatility guides options pricing and strategic trade decisions.
| Factor | Historical Volatility (HV) | Implied Volatility (IV) |
| Definition | Measures past price fluctuations over a specific period. | Estimates expected future price movements based on market sentiment. |
| Purpose | Helps analyze trends, assess risk and compare past volatility levels. | Guides options pricing, forecasts potential market movements and manages risk exposure. |
| Best Used For | Evaluating price stability, backtesting strategies and identifying past market behaviour. | Selecting strike prices, timing trades and determining fair option premiums. |
| Market Influence | Affected by past price swings, volume and historical price trends. | Driven by demand-supply dynamics, earnings, news and overall market uncertainty. |
| Trading Application | Helps assess whether current volatility is high or low compared to historical trends. | Used for options trading strategies like volatility spreads and premium calculations. |
| Volatility Timing | Backward-looking, providing insights into how volatile an asset has been. | Forward-looking, indicating the market’s expectations for future fluctuations. |
How to Use Implied and Historical Volatility Together for Better Trades with 1LY Options
Using implied and historical volatility together helps traders evaluate whether options are fairly priced. With 1lyOptions, traders can compare IV against HV to determine if market expectations align with actual price movements, leading to more strategic trade decisions.
When IV is higher than HV, options are often overpriced, making it ideal for selling strategies like credit spreads. Conversely, when IV is lower than HV, options may be undervalued, creating buying opportunities for traders anticipating increased volatility.
Difference Between Historical Volatility And Implied Volatility – Quick Summary
- The main difference between implied volatility and historical volatility is that IV forecasts future price movements based on market expectations, while HV measures past fluctuations. With 1lyOptions, traders can track both to refine strategies and enhance profitability.
- Volatility in financial markets measures the degree of price fluctuations over time. High volatility indicates rapid price swings, increasing risk, while low volatility signals stability. Investors use volatility levels to adjust strategies and manage exposure in dynamic market conditions.
- Implied volatility (IV) estimates future price fluctuations based on market expectations. Derived from options pricing, it influences contract costs. Higher IV signals uncertainty, increasing premiums, while lower IV suggests stability, making options contracts more affordable for traders and investors.
- Historical volatility (HV) measures past price movements over a specific timeframe. Unlike IV, which predicts future trends, HV calculates actual price variance, providing insights into market stability, historical risk levels and asset price behaviour over selected periods.
- The main difference between implied and historical volatility is that IV predicts future market movements, while HV reflects past fluctuations. Traders compare both indicators to assess risk, optimize trading strategies and enhance market trend analysis for better decision-making.
- Implied volatility is calculated using an options pricing model like Black-Scholes. It factors in strike price, expiration, interest rates and expected price fluctuations to estimate an asset’s future price probability, influencing options pricing and investment decisions.
- Historical volatility is calculated using standard deviation, measuring past price fluctuations. It involves averaging past price changes over a specific period and analyzing variations from the mean price to determine an asset’s historical risk and market stability.
- Analyzing volatility trends is easy with an analytics platform, offering real-time IV tracking, HV comparisons and predictive analytics. Traders can identify mispriced options, assess risk levels and execute well-informed trades to maximize returns in dynamic markets.
- Using implied and historical volatility together allows traders to determine if options are fairly priced. With an analytics platform, comparing IV against HV helps traders assess market expectations, align trades with trends and make more strategic investment decisions.
Implied Volatility Vs Historical Volatility – FAQs
1. What Is The Difference Between Historical Volatility And Implied Volatility?
The main difference is that historical volatility (HV) measures past price fluctuations, while implied volatility (IV) predicts future price movements based on market expectations. Traders compare both to assess risk, identify trading opportunities and optimize options strategies effectively.
2. What Does Historical Volatility Tell You?
Historical volatility shows how much an asset’s price has fluctuated over time. Higher HV indicates greater past price swings, signalling increased risk, while lower HV suggests stability. Traders use HV to compare past trends with current market conditions for better decision-making.
3. How Does Implied Volatility Influence Option Pricing?
Implied volatility directly affects option premiums. Higher IV increases option prices due to greater expected fluctuations, benefiting option sellers. Lower IV results in cheaper options, creating better buying opportunities for traders anticipating future volatility spikes.
4. What Is A Good Historical Volatility?
A good historical volatility level depends on the asset and market conditions. Lower HV suggests stability, ideal for conservative traders, while higher HV indicates past fluctuations, benefiting short-term or momentum traders seeking price swings.
5. How To Calculate Implied Volatility Of Nifty?
Nifty’s implied volatility is calculated using an options pricing model like Black-Scholes. It factors in market price, strike price, time to expiration, risk-free interest rates and expected price fluctuations to estimate IV accurately.
6. How Accurate Is Implied Volatility?
Implied volatility predicts expected price fluctuations but does not indicate direction. It reflects market sentiment, changing with the demand for options. While not always precise, traders use IV with other indicators for better risk assessment and strategy execution.
7. What Is The Difference Between Historical Volatility And Realized Volatility?
The main difference is that historical volatility measures past price movements over a set period, while realized volatility calculates actual price fluctuations in real time. Realized volatility is more immediate, while HV provides a broader view of past trends.
8. How Can I Use Historical Volatility to Assess Market Risk with 1LY Options?
With 1lyOptions, traders analyze historical volatility to measure past price swings and compare them with implied volatility. This helps assess market risk, identify overpriced or underpriced options and optimize trading strategies effectively.
9. What Role Does Implied Volatility Play In Options Trading Strategies?
Implied volatility helps traders determine fair option pricing, execute volatility-based strategies and manage risk. High IV benefits option sellers, while low IV creates favourable buying opportunities. Traders adjust their positions based on IV trends for optimal profitability.
10. Is High IV Good Or Bad?
High IV can be both good and bad. It increases option premiums, benefiting sellers, but raises risks due to market uncertainty. Buyers may overpay for options, making IV analysis crucial for informed trading decisions.
11. Are India VIX And IV The Same?
India VIX and implied volatility are related but not the same. India VIX measures market-wide expected volatility, while IV applies to individual options. Traders use both to assess risk and refine options trading strategies.
We hope you’re clear on the topic, but there’s more to explore in stocks, commodities, mutual funds, and related areas. Here are important topics to learn about.
Disclaimer: The above article is written for educational purposes and the companies’ data mentioned in the article may change with respect to time. The securities quoted are exemplary and are not recommendatory.