


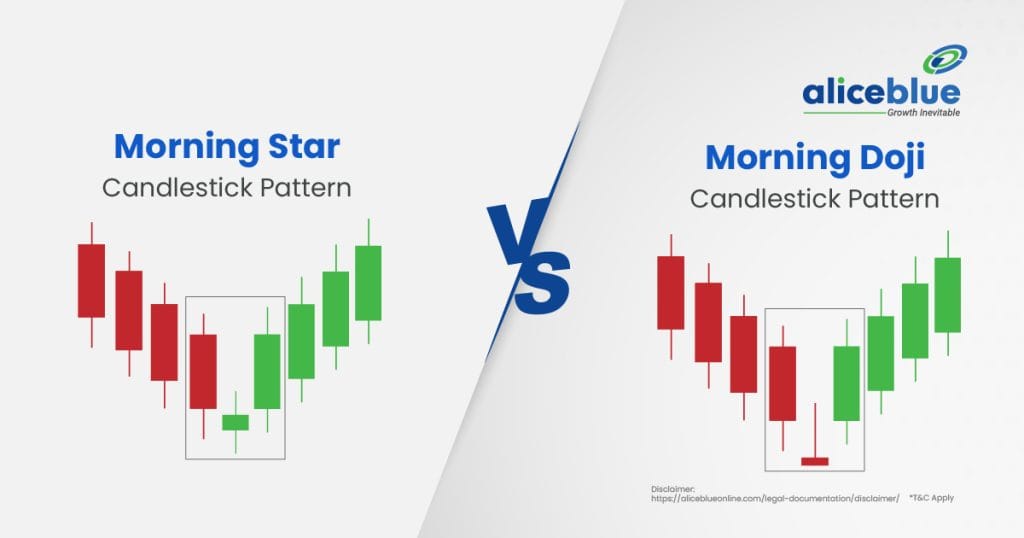
The Morning Doji Star and Morning Star are both bullish reversal patterns. The key difference is that the Morning Doji Star has a Doji in the middle, indicating stronger indecision before reversal, while the Morning Star has a small-bodied second candle.
Content:
- Morning Doji Star Meaning
- Morning Star Meaning
- Difference Between Morning Doji Star and Morning Star Candlestick Pattern
- Characteristics of Morning Doji Star
- Characteristics of Morning Star
- How to Identify a Morning Doji Star Pattern?
- How to Identify a Morning Star Candlestick Pattern?
- Trading Strategies for Morning Doji Star
- Trading Strategies for Morning Star
- Difference Between Morning Doji Star and Morning Star – Quick Summary
- Morning Doji Star vs Morning Star Candlestick Pattern – FAQs
Morning Doji Star Meaning
Morning Doji Star is a bullish reversal candlestick pattern that appears after a downtrend. It consists of three candles: a long bearish candle, a Doji indicating market indecision and a strong bullish candle confirming the trend reversal with upward momentum.
The presence of a Doji in the pattern highlights uncertainty in the market before buyers regain control. Traders see this formation as a potential signal for trend reversal, especially when supported by high trading volume and confirmation from technical indicators.

Morning Star Meaning
Morning Star is a bullish reversal candlestick pattern that forms after a downtrend, signaling a potential shift to an uptrend. It consists of three candles: a long bearish candle, a small-bodied candle showing hesitation and a strong bullish candle confirming the reversal.
The middle candle can be bullish or bearish, representing market indecision before buyers take control. Traders consider this pattern more reliable when supported by high volume and additional technical indicators like RSI or moving averages for confirmation.
Difference Between Morning Doji Star and Morning Star Candlestick Pattern
The main difference between the Morning Doji Star and the Morning Star candlestick pattern lies in the second candle. The Morning Doji Star has a Doji, indicating stronger indecision, while the Morning Star has a small-bodied candle, making it slightly less reliable for reversals.
| Aspect | Morning Doji Star | Morning Star |
| Second Candle | Contains a Doji, reflecting strong indecision before a reversal takes place. | Has a small-bodied candle, suggesting hesitation but with less uncertainty. |
| Reliability | More reliable since the Doji highlights significant market uncertainty. | Slightly less reliable but still a strong bullish reversal indicator. |
| Confirmation | It requires a strong bullish candle to confirm a trend reversal. | Needs a bullish candle closing above the first candle’s midpoint. |
| Trader Preference | Favored in highly volatile markets for better accuracy. | Commonly used for general downtrend reversals. |
Characteristics of Morning Doji Star
The main characteristic of the Morning Doji Star is its three-candle formation, indicating a potential bullish reversal. It includes a large bearish candle, a Doji showing indecision and a strong bullish candle confirming the trend change, signalling buying pressure after a downtrend.
- Three-Candle Formation: The pattern consists of a signalling candle. The Doji represents market indecision, while the bullish candle confirms the potential uptrend reversal.
- Presence of a Doji: The second candle is a Doji, which reflects uncertainty in the market. It shows that neither buyers nor sellers are in control, increasing the likelihood of a shift in momentum toward bullish sentiment.
- Confirmation Candle: The third candle must be a strong bullish candle that closes above the midpoint of the first bearish candle. This confirms the reversal and validates the strength of the new uptrend.
- Stronger Reliability in Downtrends: The pattern is more effective after a prolonged downtrend, as it indicates exhaustion in selling pressure and a potential shift toward buying momentum. The higher volume of the third candle strengthens its reliability.
Characteristics of Morning Star
The main characteristic of the Morning Star is its three-candle structure, signaling a bullish reversal after a downtrend. It consists of a long bearish candle, a small-bodied candle showing indecision and a strong bullish candle that confirms the trend reversal and buying momentum.
- Three-Candle Reversal Pattern: The Morning Star consists of a large bearish candle, a smaller candle (bullish or bearish) that signals hesitation and a strong bullish candle that confirms the reversal, indicating a shift in market sentiment from selling to buying.
- Gap Between Candles: Often, there is a gap between the first and second candles, showing a moment of uncertainty. The second candle can be bullish or bearish, but it represents reduced selling pressure and the possibility of an upcoming reversal.
- Confirmation with Bullish Candle: The third candle must be a strong bullish candle that closes above the midpoint of the first bearish candle. This confirms that buyers have regained control and establishes a potential uptrend.
- More Reliable in Downtrends: The pattern is most effective after a prolonged downtrend, as it signals seller exhaustion and a possible shift in momentum. Increased trading volume in the third candle further strengthens its reliability as a bullish reversal pattern.
How to Identify a Morning Doji Star Pattern?
To identify a Morning Doji Star pattern, look for three candles forming after a downtrend. The first is a strong bearish candle, followed by a Doji with a gap, indicating indecision. The third candle is a strong bullish move, confirming the reversal.
The Doji in the middle must have little to no body, representing market hesitation. The third bullish candle should close above the midpoint of the first candle, validating the pattern. Increased trading volume on the last candle strengthens the reliability of the bullish reversal signal.

How to Identify a Morning Star Candlestick Pattern?
To identify a Morning Star candlestick pattern, look for three candles forming after a downtrend. The first is a strong bearish candle, followed by a smaller-bodied candle that signals hesitation. The third is a strong bullish candle confirming the trend reversal.
The second candle can be a Doji or a small-bodied candle, showing market indecision. The third bullish candle must close above the midpoint of the first candle, confirming the bullish reversal. Higher trading volume on the last candle adds reliability to the pattern.

Trading Strategies for Morning Doji Star
The main trading strategy for the Morning Doji Star pattern involves confirming the reversal with volume, entering after a strong bullish confirmation, setting stop-loss levels below the Doji’s low and using resistance levels or trailing stops to maximize profit potential while managing risk effectively.
- Confirmation with Volume: Higher trading volume on the third bullish candle increases the pattern’s reliability. Traders should ensure that the breakout candle has significant volume, indicating strong buying interest and reducing the risk of a false reversal signal.
- Entry After Confirmation: Entering a trade immediately after the third bullish candle closes above the midpoint of the first bearish candle provides a safer entry. This confirms the trend reversal and improves the probability of a successful trade setup.
- Stop-Loss Placement: Setting a stop-loss just below the low of the Doji candle helps manage risk effectively. This placement ensures that if the price moves against the trade, losses are limited, preserving capital and preventing major drawdowns.
- Profit Target and Exit Strategy: Traders can set profit targets based on nearby resistance levels, Fibonacci retracement levels, or by using trailing stops. This allows capturing potential upside while ensuring profits are protected in case of a reversal or price retracement.
Trading Strategies for Morning Star
The main trading strategy for the Morning Star pattern includes waiting for confirmation, entering after the third bullish candle closes above the first candle’s midpoint, setting stop-loss below the pattern’s low and targeting key resistance levels to optimize profit potential while minimizing risk exposure.
- Confirming the Pattern: A strong bullish candle on the third day confirms the reversal. Traders should verify the pattern using indicators like RSI or MACD to ensure momentum supports the trend change before entering a position.
- Optimal Entry Timing: Entering a trade after the third bullish candle closes above the midpoint of the first bearish candle increases trade reliability. This approach confirms that buying pressure is strong enough to sustain an uptrend.
- Risk Management Strategy: Setting stop-loss below the lowest point of the Morning Star formation helps limit potential losses. This ensures that if the pattern fails, the downside is controlled without exposing the trade to excessive risk.
- Profit Booking and Exit Points: Traders should aim for resistance levels, Fibonacci retracement zones, or moving averages for profit booking. Using a trailing stop-loss allows capturing further gains if the uptrend continues while securing profits along the way.
Difference Between Morning Doji Star and Morning Star – Quick Summary
- The Morning Doji Star pattern is a bullish reversal formation that appears after a downtrend. It consists of three candles: a long bearish candle, a Doji indicating indecision and a strong bullish candle confirming the reversal and potential uptrend.
- The Morning Star pattern is a bullish reversal formation occurring at the end of a downtrend. It includes three candles: a bearish candle, a small-bodied candle showing hesitation and a strong bullish candle signalling renewed buying momentum and a potential trend shift.
- The main difference between the Morning Doji Star and Morning Star patterns is the second candle. The Morning Doji Star has a Doji reflecting market uncertainty, while the Morning Star has a small-bodied candle showing a gradual transition to bullish control.
- The Morning Doji Star pattern appears at the bottom of a downtrend, has a Doji as its second candle, reflects market indecision and is confirmed by a strong bullish candle closing above the first candle’s midpoint, indicating a potential upward move.
- The Morning Star pattern consists of three candles: a bearish candle, a small-bodied candle and a strong bullish candle. The second candle shows market hesitation, while the third candle confirms bullish momentum by closing above the first candle’s midpoint.
- The Morning Doji Star pattern is identified by a strong bearish candle, followed by a Doji that gaps down and a third bullish candle closing above the first candle’s midpoint. Volume confirmation strengthens the pattern’s reliability for traders.
- The Morning Star pattern consists of three candles: a bearish candle, a smaller-bodied candle and a strong bullish candle. The third candle should close above the first candle’s midpoint, confirming trend reversal and potential upward movement.
- The Morning Doji Star pattern requires confirmation through volume, entry after the third bullish candle, stop-loss placement below the Doji and profit targets at resistance levels or through trailing stops for effective risk management and profit-taking strategies.
- The Morning Star pattern should be confirmed by a strong bullish candle, with entry placed above its close, stop-loss below the pattern’s lowest point and profit targets determined using resistance levels, Fibonacci retracements, or moving averages for optimal trade exits.
- Open a free demat account with Alice Blue in 15 minutes today! Invest in Stocks, Mutual Funds, Bonds & IPOs for Free. Also, trade at just ₹ 20/order brokerage on every order.

Morning Doji Star vs Morning Star Candlestick Pattern – FAQs
1. What Is The Difference Between Morning Doji Star and Morning Star?
The main difference lies in the second candle. The Morning Doji Star has a Doji, signalling indecision, while the Morning Star has a small-bodied candle. The Doji Star is considered more significant due to its stronger reversal confirmation.
2. What Is A Morning Doji Star Pattern?
The Morning Doji Star is a three-candlestick bullish reversal pattern that appears after a downtrend. It consists of a long bearish candle, a Doji indicating indecision and a strong bullish candle confirming trend reversal, suggesting potential upward movement.
3. What Is Morning Star Meaning?
The Morning Star is a three-candlestick pattern signalling a bullish reversal. It starts with a long bearish candle, followed by a small-bodied candle and ends with a strong bullish candle that closes above the first candle’s midpoint, confirming trend reversal.
4. Is The Morning Doji Star Pattern Reliable?
The Morning Doji Star is highly reliable when supported by high trading volume and confirmation from technical indicators like RSI or MACD. Its Doji component adds strength to the pattern, making it a strong signal of potential trend reversal.
5. What Happens After A Morning Doji Star Pattern?
After a Morning Doji Star, bullish momentum often follows. Traders expect a price increase as buyers gain control. If confirmed by high volume and further bullish candles, the pattern strengthens, leading to a sustained uptrend.
6. What Happens After A Morning Star Candlestick Pattern?
A Morning Star pattern usually results in a bullish trend continuation. If confirmed by increasing volume and additional bullish candles, it indicates strong buying pressure, potentially leading to a longer uptrend and reversal of prior bearish sentiment.
7. Is Morning Star A Stronger Signal Than Morning Doji Star?
The Morning Doji Star is generally considered stronger than the Morning Star due to Doji’s role in signalling market indecision before reversal. However, both patterns are reliable when validated with volume and additional technical indicators.
8. What Does A Morning Doji Star Pattern Indicate?
The Morning Doji Star pattern indicates a potential bullish reversal. It suggests that selling pressure is weakening and buyers are stepping in, leading to an upward price movement if confirmed by subsequent bullish candles and high trading volume.
9. What Is The Opposite Of The Morning Star Pattern?
The opposite of the Morning Star pattern is the Evening Star. This bearish reversal pattern consists of a long bullish candle, a small-bodied candle and a strong bearish candle, signalling a potential downward trend.
10. Can Morning Doji Star and Morning Star Occur In Both Bullish And Bearish Markets?
Both patterns typically form in bearish markets and signal a bullish reversal. However, they do not appear in bullish trends since they are designed to indicate the exhaustion of selling pressure and a potential upward shift in price movement.
We hope you’re clear on the topic, but there’s more to explore in stocks, commodities, mutual funds, and related areas. Here are important topics to learn about.
Disclaimer: The above article is written for educational purposes and the companies’ data mentioned in the article may change with respect to time. The securities quoted are exemplary and are not recommendatory.





