


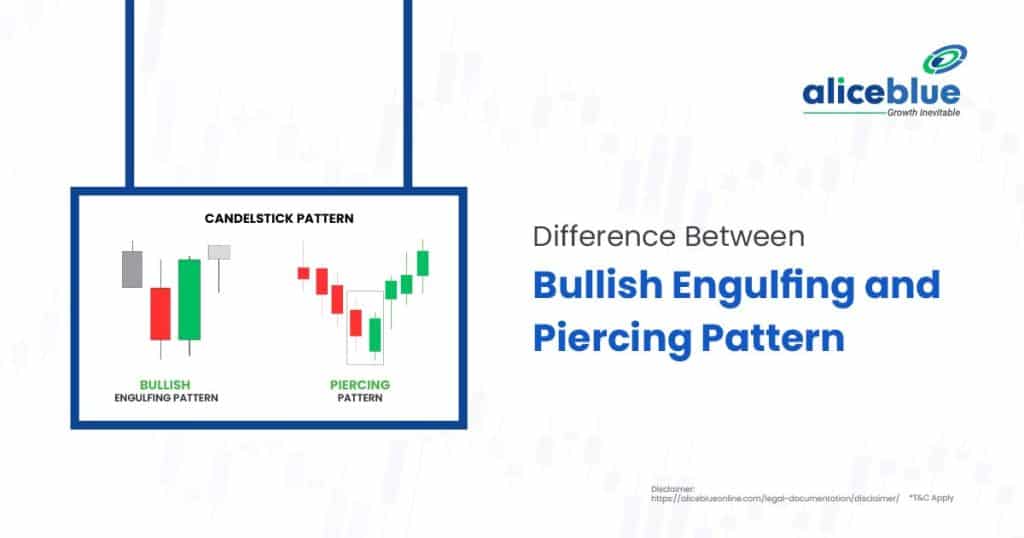
Bullish Engulfing and Piercing Patterns are bullish reversal candlestick formations. Bullish Engulfing fully engulfs the previous bearish candle, signalling strong buying momentum. The Piercing Pattern covers at least half of the prior bearish candle, indicating moderate bullish strength. Engulfing is generally a stronger reversal signal.
Content:
- Bullish Engulfing Meaning
- What Is Piercing Pattern?
- Difference Between Bullish Engulfing And Piercing Pattern
- Characteristics Of Bullish Engulfing
- Characteristics Of Piercing Pattern
- How To Identify A Bullish Engulfing Pattern?
- How To Identify A Piercing Pattern?
- Trading Strategies For Bullish Engulfing
- Trading Strategies For Piercing Pattern
- Difference Between Bullish Engulfing and Piercing Pattern – Quick Summary
- Bullish Engulfing vs Piercing Pattern – FAQs
Bullish Engulfing Meaning
Bullish Engulfing is a strong bullish reversal candlestick pattern that occurs after a downtrend. It consists of a small bearish candle followed by a larger bullish candle that completely engulfs the previous one, signalling a shift from selling pressure to buying momentum.
This pattern indicates that buyers have gained control, potentially leading to a trend reversal. It is more reliable when accompanied by high trading volume and appears at key support levels. Traders often seek confirmation with additional bullish candles or technical indicators before making decisions.

What Is Piercing Pattern?
The Piercing Pattern is a bullish reversal candlestick formation that appears after a downtrend. It consists of a bearish candle followed by a bullish candle that closes above the midpoint of the previous candle, signalling a potential shift from selling to buying momentum.
This pattern indicates that buyers are regaining control, but it requires confirmation through follow-up bullish candles or increased volume. The Piercing Pattern is most effective when formed at key support levels and can signal a trend reversal if supported by other technical indicators.
Difference Between Bullish Engulfing And Piercing Pattern
The main difference between Bullish Engulfing and Piercing Pattern is that Bullish Engulfing completely engulfs the previous bearish candle, showing strong buying pressure, while the Piercing Pattern covers only half of the prior candle, indicating moderate bullish strength. Engulfing is a stronger reversal signal.
| Aspect | Bullish Engulfing | Piercing Pattern |
| Candle Formation | A large bullish candle fully engulfs the previous bearish candle | The bullish candle closes above the midpoint of the prior bearish candle |
| Strength of Reversal | Strong reversal signal | Moderate reversal signal |
| Confirmation Needed | Less confirmation is required due to strong reversal | Requires additional confirmation through volume or price action |
| Market Implication | Indicates strong bullish momentum | Suggests buying pressure but needs further validation |
| Best Usage | More effective in major downtrends at key support levels | Works well when supported by technical indicators and volume |
Characteristics Of Bullish Engulfing
The main characteristics of the Bullish Engulfing pattern include a two-candle bullish reversal formation that appears after a downtrend. It consists of a small bearish candle followed by a larger bullish candle that completely engulfs the previous one, signalling strong buying pressure and a potential trend reversal.
- Complete Engulfing Formation: The second bullish candle fully engulfs the body of the previous bearish candle, showing a decisive shift in market sentiment from sellers to buyers.
- Forms After a Downtrend: This pattern appears at the bottom of a downtrend, suggesting that selling pressure is fading and buyers are regaining control, potentially reversing the trend.
- Strong Bullish Momentum: A large bullish candle after a bearish phase indicates aggressive buying interest, increasing the likelihood of an upward movement in price.
- Confirmation Factors: Traders look for high volume, a follow-up bullish candle, RSI divergence, or a breakout above resistance levels to validate the pattern before entering a trade.
Characteristics Of Piercing Pattern
The main characteristics of the Piercing Pattern include a two-candle bullish reversal formation that appears after a downtrend. It consists of a strong bearish candle followed by a bullish candle that opens lower but closes above the midpoint of the previous candle, signaling a potential reversal.
- Bullish Reversal Formation: The pattern starts with a bearish candle, followed by a bullish candle that gaps down but recovers to close above the midpoint of the previous candle, indicating a shift in momentum.
- Occurs in a Downtrend: The Piercing Pattern forms after a prolonged downtrend, suggesting that selling pressure is weakening and buyers are stepping in to regain control, potentially leading to a trend reversal.
- Stronger Buying Pressure: The second candle’s strong upward movement shows that buyers are absorbing selling pressure, pushing the price higher, though further confirmation is needed for reliability.
- Needs Confirmation Signals: Traders watch for high volume, a follow-up bullish candle, RSI divergence, or a break above key resistance levels to confirm the pattern’s validity before making trading decisions.
How To Identify A Bullish Engulfing Pattern?
To identify a Bullish Engulfing pattern, look for a small bearish candle followed by a larger bullish candle that completely engulfs the previous one. This formation appears after a downtrend, signalling a potential reversal as buyers overpower sellers with strong momentum.
Confirmation requires additional factors like high trading volume, bullish follow-through candles, or technical indicators such as RSI divergence and moving average crossovers. The pattern is more reliable when it forms at key support levels, indicating a stronger probability of an upward trend continuation.

How To Identify A Piercing Pattern?
To identify a Piercing Pattern, look for a two-candle formation after a downtrend. The first candle is bearish, followed by a bullish candle that opens lower but closes above the midpoint of the previous candle, indicating a potential shift in momentum.
For confirmation, traders check for high trading volume, follow-up bullish candles, or technical indicators like RSI divergence and support level reactions. The pattern is stronger when it forms near key support zones, suggesting that buyers are gaining control and a reversal may occur.

Trading Strategies For Bullish Engulfing
The main trading strategy for the Bullish Engulfing pattern is to enter a long position after confirmation of the reversal. Traders look for additional signals like high volume, RSI divergence, or a break above resistance to ensure a strong bullish continuation before making a trade.
- Entry Point: Enter a trade after the bullish candle closes, preferably with confirmation from a follow-up bullish candle or a breakout above a key resistance level to increase reliability.
- Stop-Loss Placement: Place a stop-loss below the low of the engulfing pattern to manage risk. This ensures protection against false breakouts or unexpected market reversals.
- Profit Target: Set a target based on previous resistance levels or Fibonacci retracement zones. Traders can also use risk-reward ratios to optimize their exit strategy for maximum gains.
- Additional Confirmation: Use indicators like RSI divergence, moving average crossovers, or increased trading volume to confirm the pattern. A combination of signals improves the success rate of the trade.
Trading Strategies For Piercing Pattern
The main trading strategy for the Piercing Pattern is to identify the pattern near key support levels and confirm the bullish reversal before entering a trade. Traders should watch for strong volume, RSI divergence, or a follow-up bullish candle to validate the signal.
- Buying Opportunity: Enter a trade when the bullish candle closes above the midpoint of the previous bearish candle. A confirmation candle or a break above a resistance level strengthens the trade setup and reduces the risk of false signals.
- Risk Management: Set a stop-loss below the lowest point of the pattern to limit downside risk. This ensures protection against market reversals while allowing the trade enough room to develop in favour of the bullish trend.
- Target Setting: Aim for profit targets at significant resistance levels or previous swing highs. Using Fibonacci retracement levels can also help determine potential upside targets for maximizing gains while maintaining a good risk-reward ratio.
- Confirmation Signals: Look for additional validation through indicators like RSI divergence, moving average crossovers, or strong buying volume. These elements enhance the credibility of the pattern, improving the chances of a successful trade execution.
Difference Between Bullish Engulfing and Piercing Pattern – Quick Summary
- A two-candle bullish reversal pattern where a larger bullish candle fully engulfs the previous bearish candle. It signals strong buying pressure and a potential uptrend after a downtrend, indicating a shift in market sentiment.
- A two-candle bullish reversal pattern forms after a downtrend. The second bullish candle opens lower but closes above the midpoint of the previous bearish candle, indicating a potential trend reversal as buyers gain control.
- Bullish Engulfing engulfs the entire previous bearish candle, while Piercing Pattern closes above its midpoint. Engulfing is a stronger signal, confirming strong buying momentum, whereas Piercing suggests a potential reversal needing further confirmation.
- Appears after a downtrend, consists of a small bearish candle followed by a larger bullish candle, signals strong buying momentum and requires additional confirmation through high volume, RSI divergence, or resistance breakout for reliability.
- A two-candle formation with a bearish first candle and a bullish second candle closing above the previous candle’s midpoint. It signals potential reversal but needs confirmation through volume, RSI divergence, or key support levels.
- Look for a downtrend, followed by a small bearish candle and a larger bullish candle engulfing it. Confirmation comes from high volume, bullish follow-through, or RSI divergence for a stronger reversal signal.
- Identify a downtrend with a bearish candle followed by a bullish candle opening lower but closing above the midpoint of the previous candle. Confirmation includes strong volume, bullish follow-through, or support-level validation.
- Enter after confirmation from volume or follow-up candles, place stop-loss below the pattern, set profit targets at resistance levels and use additional indicators like RSI divergence for stronger trade confidence.
- Enter after confirmation from a bullish follow-up, place stop-loss below the pattern’s low, target previous resistance levels or Fibonacci zones and confirm with RSI divergence or moving average crossovers for increased reliability.
- Open a free demat account with Alice Blue in 15 minutes today! Invest in Stocks, Mutual Funds, Bonds & IPOs for Free. Also, trade at just ₹ 20/order brokerage on every order.

Bullish Engulfing vs Piercing Pattern – FAQs
1. What Is The Difference Between Bullish Engulfing And Piercing Pattern?
A Bullish Engulfing pattern fully engulfs the previous bearish candle, signalling a strong reversal. The Piercing Pattern covers only half or more of the prior bearish candle, indicating moderate bullish sentiment. Bullish Engulfing is generally considered a stronger reversal signal than the Piercing Pattern.
2. What Is Bullish Engulfing?
A Bullish Engulfing pattern occurs when a large bullish candle completely engulfs the previous bearish candle. It signals strong buying momentum and a potential trend reversal. This pattern is most effective when formed at support levels or after a prolonged downtrend, confirming bullish strength.
3. What Is Piercing Pattern?
A Piercing Pattern consists of a bearish candle followed by a bullish candle that closes above the midpoint of the previous candle. It suggests a potential reversal but requires confirmation. This pattern appears at support levels and signals moderate bullish momentum, often leading to upward movement.
4. Is The Piercing Pattern Reliable?
The Piercing Pattern is moderately reliable, especially when it forms at key support levels. However, it requires confirmation from additional bullish signals, such as increased volume or follow-up bullish candles. It is less powerful than the Bullish Engulfing pattern but still indicates potential trend reversals.
5. What Happens After A Bullish Engulfing Pattern?
After a Bullish Engulfing pattern, prices often move higher, confirming a bullish reversal. Traders look for increased buying volume and follow-up bullish candles. If supported by strong market conditions, it can lead to sustained upward trends, especially when occurring at significant support levels.
6. What Happens After A Piercing Pattern?
A Piercing Pattern often leads to a short-term bullish move. If confirmed by additional bullish candles and volume, it may signal a trend reversal. However, without strong follow-through buying, the reversal may be weak, requiring further confirmation from technical indicators or price action.
7. Is Bullish Engulfing A Stronger Signal Than Piercing Pattern?
Yes, Bullish Engulfing is a stronger signal than the Piercing Pattern. It shows complete domination by buyers, leading to a higher probability of a trend reversal. The Piercing Pattern suggests bullish momentum but requires confirmation, making it less reliable than Bullish Engulfing.
8. What Does A Bullish Engulfing Pattern Indicate?
A Bullish Engulfing pattern indicates a strong shift in momentum from bearish to bullish. It suggests that buyers have taken control, potentially reversing the prevailing downtrend. This pattern is more effective when accompanied by high trading volume and occurring at key support levels.
9. What Is The Opposite Of The Piercing Pattern?
The opposite of the Piercing Pattern is the Dark Cloud Cover pattern. It consists of a strong bullish candle followed by a bearish candle that closes below the midpoint of the previous candle. It signals a potential bearish reversal when formed at resistance levels.
10. What Does A Piercing Line Pattern Indicate?
A Piercing Line pattern indicates a potential bullish reversal after a downtrend. It suggests that buying pressure is increasing, pushing prices higher. However, traders seek confirmation through additional bullish price action or volume spikes to validate the strength of the reversal.
We hope you’re clear on the topic, but there’s more to explore in stocks, commodities, mutual funds, and related areas. Here are important topics to learn about.
Disclaimer: The above article is written for educational purposes and the companies’ data mentioned in the article may change with respect to time. The securities quoted are exemplary and are not recommendatory.





