


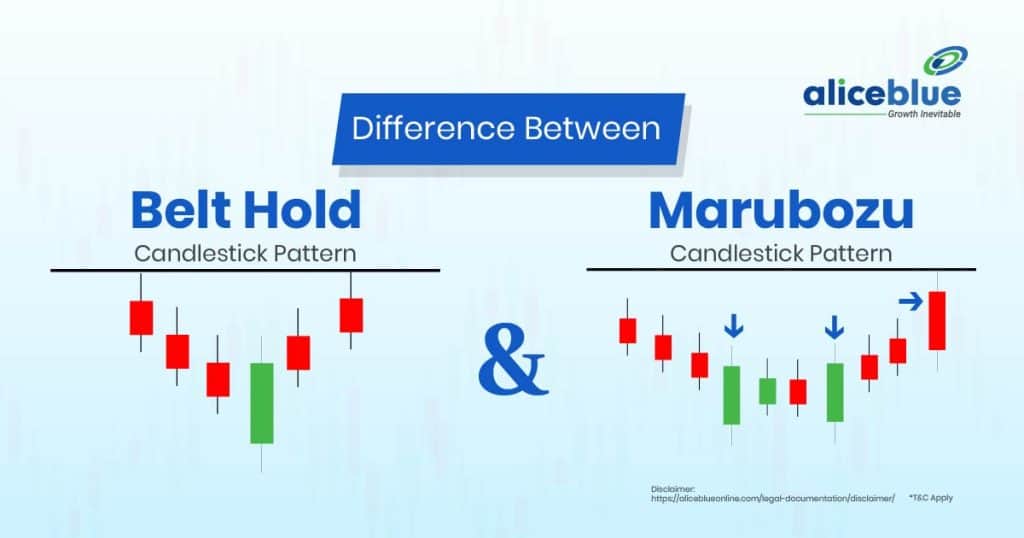
Belt Hold and Marubozu are strong candlestick patterns. Belt Hold signals a potential reversal with a small wick, while Marubozu has no wicks, showing strong momentum. Marubozu confirms trend continuation, whereas Belt Hold suggests a temporary market shift needing further confirmation.
Content:
- Belt Hold Pattern Meaning
- Marubozu Meaning
- Difference Between Belt Hold and Marubozu Candlestick Pattern
- Characteristics of Belt Hold Pattern
- Characteristics of Marubozu
- How to Identify a Belt Hold Pattern?
- How to Identify a Marubozu Candlestick Pattern?
- Trading Strategies for Belt Hold
- Trading Strategies for Marubozu
- Difference Between Belt Hold and Marubozu – Quick Summary
- Belt Hold vs Marubozu Candlestick Pattern – FAQs
Belt Hold Pattern Meaning
The Belt Hold pattern is a candlestick formation signaling a potential trend reversal. It appears in both bullish and bearish forms. A Bullish Belt Hold occurs after a downtrend with a long-bodied candle opening at its low, indicating strong buying pressure and reversal potential.
A Bearish Belt Hold forms after an uptrend with a long-bodied candle opening at its high, suggesting selling dominance. This pattern lacks significant wicks, reinforcing conviction. While Belt Hold indicates a shift in market sentiment, traders often seek confirmation from volume and subsequent candlesticks.

Marubozu Meaning
A Marubozu is a strong candlestick pattern that lacks wicks, indicating decisive market sentiment. A Bullish Marubozu has a long body with no upper or lower shadows, showing strong buying momentum, and suggesting a potential uptrend or continuation of an existing bullish trend.
A Bearish Marubozu has a long body without wicks, signifying strong selling pressure. It indicates that sellers controlled the price throughout the session, often leading to further declines. Marubozu patterns provide clear signals of market strength but are best used with confirmation indicators.
Difference Between Belt Hold and Marubozu Candlestick Pattern
The main difference between the Belt Hold and Marubozu patterns is that Belt Hold has a small wick on one side, indicating a slight retracement, whereas Marubozu has no wicks, showing strong momentum. Marubozu confirms trend continuation, while Belt Hold signals a possible reversal.
| Aspect | Belt Hold | Marubozu |
| Structure | Has a long body with a small wick on one side, showing minor retracement before reversal. | Has a full body with no wicks, indicating strong momentum and control by buyers or sellers. |
| Signal Type | Indicates a potential reversal in both bullish and bearish trends. | Suggests a strong continuation of the current trend, either upward or downward. |
| Market Sentiment | Shows a shift in control from sellers to buyers (bullish) or buyers to sellers (bearish). | Reflects absolute dominance by buyers (bullish) or sellers (bearish) throughout the session. |
| Confirmation Need | Requires additional confirmation from volume or follow-up candles. | Stronger signal due to no wicks, but still benefits from confirmation indicators. |
Characteristics of Belt Hold Pattern
The main characteristic of the Belt Hold pattern is its long-bodied candle with a small wick on one side, indicating strong market sentiment. It appears in both bullish and bearish forms, signaling a potential trend reversal depending on its position in the price movement.
- Single Long Candle Formation: A Belt Hold pattern consists of a single, long-bodied candlestick with minimal or no wick on one side. This structure suggests strong market momentum, with buyers or sellers taking control from the start and maintaining dominance throughout the trading session.
- Bullish and Bearish Variants: The Bullish Belt Hold appears after a downtrend, opening at its low and closing higher, indicating buying strength. The Bearish Belt Hold forms after an uptrend, opening at its high and closing lower, suggesting strong selling pressure and potential reversal.
- Reversal Signal: This pattern typically signals a trend reversal. A Bullish Belt Hold suggests a shift from selling to buying pressure, while a Bearish Belt Hold indicates a move from buying to selling. However, traders often seek additional confirmation before acting on the pattern.
- Requires Market Context for Confirmation: Although the Belt Hold pattern is a strong signal, it is more effective when supported by volume and other technical indicators. A confirmed breakout or follow-up candlestick in the expected direction enhances its reliability in predicting trend changes.
Characteristics of Marubozu
The main characteristic of the Marubozu pattern is its long-bodied candlestick with no wicks, indicating strong market dominance. It appears in both bullish and bearish forms, signifying trend continuation or reversal depending on its position in the price movement and overall market context.
- No Wicks or Shadows: A Marubozu candlestick has no upper or lower wicks, meaning the opening and closing prices represent the high and low of the session. This indicates strong momentum, with buyers (bullish) or sellers (bearish) maintaining control throughout the period.
- Bullish and Bearish Variants: A Bullish Marubozu opens at the low and closes at the high, showing intense buying pressure. A Bearish Marubozu opens at the high and closes at the low, reflecting strong selling momentum and potential further downside movement.
- Trend Continuation or Reversal: In an uptrend, a Bullish Marubozu confirms continuation, while in a downtrend, a Bearish Marubozu signals further decline. However, if Marubozu appears after a prolonged trend, it may suggest an impending reversal due to market exhaustion.
- High Reliability with Confirmation: Marubozu is a strong signal but works best when supported by volume and other indicators. A follow-up candle in the same direction, along with high trading volume, enhances its effectiveness in predicting future price movements.
How to Identify a Belt Hold Pattern?
To identify a Belt Hold pattern, look for a single long-bodied candlestick with little to no wick on one side. A Bullish Belt Hold appears after a downtrend, opening at its lowest price and closing significantly higher, signaling strong buying pressure.
A Bearish Belt Hold forms after an uptrend, opening at its highest price and closing much lower, indicating strong selling momentum. The pattern gains reliability when it appears at key support or resistance levels, with confirmation from volume and subsequent candlestick formations.

How to Identify a Marubozu Candlestick Pattern?
To identify a Marubozu candlestick pattern, look for a long-bodied candle with no wicks, meaning the opening and closing prices represent the session’s high and low. A Bullish Marubozu opens at its low and closes at its high, showing strong buying pressure.
A Bearish Marubozu opens at its high and closes at its low, indicating dominant selling momentum. This pattern is more reliable when aligned with existing trends and supported by volume. It signals trend continuation or potential reversal, depending on its position within the broader market movement.

Trading Strategies for Belt Hold
The main trading strategy for the Belt Hold pattern involves identifying its position within a trend and confirming its reliability with volume and other indicators. Traders use it for potential reversals or trend continuations, depending on whether it appears as a bullish or bearish formation.
- Confirm with Volume and Indicators: A Belt Hold pattern is stronger when supported by high trading volume. Using indicators like RSI or MACD helps confirm whether the market is truly reversing or just experiencing a temporary price movement before continuing its trend.
- Entry and Stop-Loss Placement: For a Bullish Belt Hold, traders enter a long position after confirmation, placing a stop-loss below the pattern’s low. In a Bearish Belt Hold, short positions are taken with a stop-loss above the candlestick’s high to manage risk effectively.
- Use Support and Resistance Levels: The Belt Hold pattern becomes more reliable when it forms near key support or resistance zones. A Bullish Belt Hold at support indicates strong buying interest, while a Bearish Belt Hold near resistance suggests a potential price reversal downward.
- Watch for Confirmation Candles: Since a single candlestick pattern can sometimes be misleading, traders wait for a confirming candle in the expected direction. A bullish follow-up strengthens a Bullish Belt Hold, while a bearish continuation candle validates the strength of a Bearish Belt Hold signal.
Trading Strategies for Marubozu
The main trading strategy for the Marubozu pattern involves recognizing its role in trend continuation or reversal and confirming its reliability with volume and technical indicators. Traders use it to enter trades in the dominant trend direction or anticipate potential reversals at key price levels.
- Trade with the Trend: A Bullish Marubozu in an uptrend signals strong buying momentum, making it an ideal entry point for long positions. Conversely, a Bearish Marubozu in a downtrend suggests a further decline, prompting traders to take short positions for potential profit continuation.
- Confirm with Volume and Indicators: Higher trading volume strengthens the Marubozu pattern’s reliability. Traders use indicators like RSI or MACD to ensure the market isn’t overbought or oversold before making a trade decision, reducing the risk of false signals.
- Entry and Stop-Loss Placement: Traders enter long positions after a Bullish Marubozu closes, setting a stop-loss below its low. For a Bearish Marubozu, short positions are taken with a stop-loss above its high, ensuring controlled risk management in case of unexpected price reversals.
- Watch for Key Levels and Breakouts: Marubozu patterns near support or resistance levels are significant. A breakout with a Marubozu candle confirms trend strength, while its appearance at exhaustion points may indicate an impending reversal, requiring further confirmation before executing trades.
Difference Between Belt Hold and Marubozu – Quick Summary
- A Belt Hold pattern is a single long candlestick with little or no wick on one side, indicating strong market momentum. It signals a potential trend reversal, depending on whether it forms as bullish or bearish.
- A Marubozu candlestick has no wicks, meaning the open and close prices represent the session’s high and low. It signifies strong market control by buyers (bullish) or sellers (bearish), leading to trend continuation or potential reversal.
- The Belt Hold has a small wick on one side, while Marubozu has no wick. Belt Hold signals reversals, while Marubozu indicates trend strength. Both require confirmation from volume and market context for reliable trading decisions.
- A long-bodied candlestick with a small wick on one side, appearing in bullish and bearish forms. It signals a potential trend reversal and becomes more reliable when confirmed by volume and technical indicators at key price levels.
- The Marubozu candlestick has no wicks, indicating strong market control. It appears in bullish and bearish forms, signaling trend continuation or reversal, and is most reliable when confirmed by volume and other indicators.
- The Belt Hold pattern is a single long candlestick with little to no wick on one side, signaling trend reversal. Bullish appears after a downtrend, bearish after an uptrend, gaining reliability with key levels and volume confirmation.
- A Marubozu candlestick has a long body with no wicks, showing strong market control. Bullish Marubozu signals buying pressure, while Bearish indicates selling dominance. It suggests trend continuation or reversal, gaining reliability with volume confirmation.
- Traders confirm Belt Hold patterns with volume and indicators before entering trades. Stop-losses are set below or above the pattern, and its effectiveness increases when it forms near support or resistance levels with a confirming follow-up candle.
- Trading Marubozu involves following the trend, confirming with volume, and using indicators like RSI. Traders enter trades in the direction of the Marubozu candle while setting stop-losses to manage risk and improve trade success probability.
- Open a free demat account with Alice Blue in 15 minutes today! Invest in Stocks, Mutual Funds, Bonds & IPOs for Free. Also, trade at just ₹ 20/order brokerage on every order.

Belt Hold vs Marubozu Candlestick Pattern – FAQs
1. What Is The Difference Between Belt Hold and Marubozu?
Belt Hold and Marubozu are both strong candlestick patterns. Belt Hold has a small wick and signals trend reversal, while Marubozu has no wicks, indicating strong momentum. Marubozu suggests a more decisive trend, whereas Belt Hold often appears as a temporary market correction signal.
2. What Is A Belt Hold Pattern?
A Belt Hold pattern is a single candlestick formation that signals a potential reversal. It opens at the session’s high (for bearish) or low (for bullish) and moves strongly in one direction, leaving little or no upper or lower shadow, showing strong price control.
3. What is Marubozu Meaning?
A Marubozu candlestick is a solid-bodied candle with no wicks, showing strong market sentiment. A bullish Marubozu indicates buyers dominated, closing at the high, while a bearish Marubozu suggests strong selling pressure, closing at the low. It confirms strong momentum in the trend’s direction.
4. Is The Belt Hold Pattern Reliable?
The Belt Hold pattern is a moderately reliable reversal indicator, especially when confirmed by volume and other technical signals. It works best when appearing after an extended trend and is more effective when followed by further confirmation, such as continuation candles or supportive indicators.
5. What Happens After A Belt Hold Pattern?
After a Belt Hold pattern, the market may continue the reversal if supported by strong momentum and volume. However, if there is no confirmation from subsequent candlesticks, the price may consolidate or resume the previous trend. It requires additional technical analysis for validation.
6. What Happens After A Marubozu Candlestick Pattern?
After a Marubozu candlestick, the trend usually continues in the same direction due to strong momentum. A bullish Marubozu signals continued buying pressure, while a bearish Marubozu indicates further selling. Confirmation from volume and subsequent candles strengthens the pattern’s reliability for traders.
7. Is Marubozu A Stronger Signal Than Belt Hold?
Yes, Marubozu is generally a stronger signal than Belt Hold because it represents absolute market dominance by buyers or sellers. The absence of wicks means no price hesitation, whereas Belt Hold has small wicks, indicating some resistance. Marubozu offers stronger trend confirmation.
8. What Does A Belt Hold Pattern Indicate?
A Belt Hold pattern indicates a possible trend reversal. A bullish Belt Hold shows buyers taking control after a downtrend, while a bearish Belt Hold signals sellers overpowering buyers after an uptrend. It suggests market sentiment is shifting, but confirmation is needed.
9. What Is The Opposite Of The Marubozu Pattern?
The opposite of the Marubozu pattern is a Doji candlestick. While Marubozu shows strong momentum with no wicks, Doji represents indecision, as the open and close prices are nearly the same. Doji signals potential trend reversals or market uncertainty, requiring further confirmation.
10. What Does A Marubozu Pattern Suggest?
A Marubozu pattern suggests strong market conviction. A bullish Marubozu indicates aggressive buying with no selling pressure, signaling a strong uptrend. A bearish Marubozu suggests heavy selling pressure, leading to a strong downtrend. It is a powerful continuation or reversal indicator.
We hope you’re clear on the topic, but there’s more to explore in stocks, commodities, mutual funds, and related areas. Here are important topics to learn about.
Disclaimer: The above article is written for educational purposes and the companies’ data mentioned in the article may change with respect to time. The securities quoted are exemplary and are not recommendatory.





