


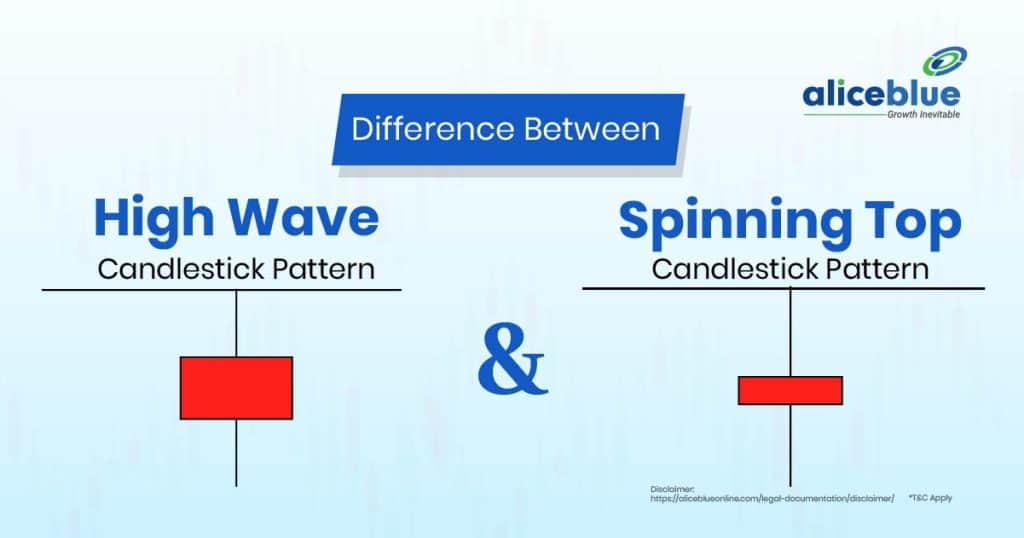
A High Wave Candle indicates strong market indecision with long upper and lower wicks and a small body, showing volatility. In contrast, a Spinning Top has a small real body with shorter wicks, signalling balanced buying and selling pressure but requiring confirmation for trend direction.
Content:
- What Is a High Wave Candle?
- High Wave Candle Example
- Spinning Top Meaning
- Spinning Top Candlestick Pattern Example
- Difference Between High Wave Candle And Spinning Top Candlestick Pattern
- How to Identify a High Wave Candle Pattern?
- How to Identify a Spinning Top Candlestick Pattern?
- Difference Between High Wave Candle And Spinning Top – Quick Summary
- High Wave Candle Vs Spinning Top – FAQS
What Is a High Wave Candle?

A High Wave Candle is a candlestick pattern that signals strong market indecision and volatility. It has long upper and lower wicks with a small real body, showing that buyers and sellers pushed prices in both directions but failed to establish dominance.
This pattern often appears during trend reversals or consolidations, indicating that the market is struggling to find direction. A High Wave Candle alone is not a strong signal, but when followed by a confirmation candle, it can provide insight into future price movement..

High Wave Candle Example
A High Wave Candle in an uptrend suggests that buyers attempted to push prices higher, but strong resistance caused a pullback. If the next candle is bearish, it may signal a trend reversal.
For example, if a stock is at ₹800, it moves up to ₹850, then drops to ₹780 and finally closes near ₹810, forming a High Wave Candle. This indicates uncertainty, requiring traders to wait for the next candle’s confirmation.
Spinning Top Meaning

A Spinning Top is a candlestick pattern that represents market indecision. It has a small real body with upper and lower wicks of nearly equal length, showing that buying and selling forces are balanced, preventing a clear price direction.
The Spinning Top can appear in uptrends, downtrends, or sideways markets. It suggests weak momentum, requiring confirmation from the next candle to determine if the market will continue in the same direction or reverse.
Spinning Top Candlestick Pattern Example
A Spinning Top in an uptrend signals that buyers are losing strength, while in a downtrend, it shows that sellers are slowing down. It often precedes a trend reversal or consolidation.
For example, if a stock is in a downtrend at ₹500, moves up to ₹520, drops to ₹490 and closes at ₹505, it forms a Spinning Top. This signals uncertainty, requiring confirmation from the next candle.
Difference Between High Wave Candle And Spinning Top Candlestick Pattern
The High Wave Candle and Spinning Top are both candlestick patterns that indicate market indecision, but they differ in structure and significance. High Wave Candles have longer wicks, showing strong volatility, while Spinning Tops have shorter, equal wicks, signalling a balanced struggle between buyers and sellers.
| Aspect | High Wave Candle | Spinning Top |
| Pattern Structure | Has long upper and lower wicks with a small body. | Has a small real body with nearly equal upper and lower wicks. |
| Market Sentiment | Indicates strong volatility and uncertainty in price movement. | Shows balanced buying and selling pressure, requiring confirmation. |
| Strength of Signal | Stronger as it reflects sharp price swings within a session. | Weaker unless confirmed by the next candle’s direction. |
| Occurrence in Trends | Appears in all market conditions, often before a trend reversal. | Common in uptrends and downtrends, signalling indecision before continuation or reversal. |
| Confirmation Needed | Needs a strong next candle and volume confirmation. | Requires follow-through price action to confirm a trend direction. |
How to Identify a High Wave Candle Pattern?
A High Wave Candle is identified by its long upper and lower wicks and small real body, showing market indecision.
- Look for Long Upper and Lower Wicks
The wicks should be significantly longer than the real body, indicating strong volatility. - Check the Small Real Body
The body should be small, showing that neither buyers nor sellers could dominate the session. - Confirm with the Next Candle
A bullish or bearish confirmation candle helps determine the next price direction. - Analyze Volume for Market Strength
A high trading volume with a High Wave Candle increases the pattern’s reliability.
How to Identify a Spinning Top Candlestick Pattern?
A Spinning Top is identified by its small real body and almost equal upper and lower wicks, indicating indecision.
- Look for a Small Real Body
The body should be small, showing that buyers and sellers were equally strong. - Check for Nearly Equal Wicks
The upper and lower wicks should be of similar length, signalling a balance in market forces. - Confirm with the Next Candle
A bullish or bearish candle after the Spinning Top determines the trend direction. - Use Volume and Indicators for Accuracy
Increasing volume and RSI divergence help confirm the pattern’s validity.
Difference Between High Wave Candle And Spinning Top – Quick Summary
- A High Wave Candle is a candlestick pattern with long upper and lower wicks and a small real body, indicating market indecision and high volatility. It suggests that buyers and sellers struggled for control but failed to establish a clear trend direction.
- A Spinning Top is a candlestick pattern with a small real body and nearly equal wicks, representing market indecision. It indicates that neither buyers nor sellers had control, requiring confirmation from the next candle for a clear trend direction.
- A High Wave Candle is identified by long upper and lower wicks and a small real body. Traders confirm it with volume, RSI and the next candle’s movement, which determines if the trend continues or reverses.
- A Spinning Top is recognized by a small real body with nearly equal wicks. It signals market indecision and needs confirmation from the next candle and technical indicators like volume and momentum oscillators.
- Open a free demat account with Alice Blue in 15 minutes today! Invest in Stocks, Mutual Funds, Bonds & IPOs for Free. Also, trade at just ₹ 20/order brokerage on every order.

High Wave Candle Vs Spinning Top – FAQS
1. What Is The Difference Between A High Wave Candle And A Spinning Top?
A High Wave Candle has longer wicks, showing strong volatility, while a Spinning Top has shorter, nearly equal wicks, indicating market indecision with balanced buying and selling pressure, requiring confirmation for trend direction.
2. How Do Traders Interpret A High Wave Candle?
Traders see a High Wave Candle as strong indecision and volatility, signalling hesitation in price movement. It often appears before reversals or consolidations, requiring confirmation from the next candle and volume analysis.
3. What Does A Spinning Top Indicate In Technical Analysis?
A Spinning Top suggests market indecision, where buyers and sellers are equally strong. It can indicate trend continuation or reversal, depending on the next candle’s confirmation and overall market trend.
4. Can A High Wave Candle Or Spinning Top Signal A Trend Reversal?
Yes, both patterns can signal trend reversals if followed by strong confirmation candles. A bullish or bearish follow-through candle helps determine whether the price continues in the same direction or reverses.
5. Can High Wave Candles And Spinning Tops Appear In All Markets?
Yes, High Wave Candles and Spinning Tops appear in stocks, forex and commodities. These patterns occur in any market condition and help traders identify potential reversals or consolidations.
6. Which Is More Reliable, a High Wave Candle Or a Spinning Top?
A High Wave Candle is more reliable as it reflects higher volatility. The Spinning Top requires strong confirmation since its smaller body and symmetrical wicks indicate weaker price action than the High Wave Candle.
7. What Is The Best Way To Trade A Spinning Top?
Traders wait for confirmation from the next candle before entering trades. If the next candle is bullish, they go long and if bearish, they enter short positions with a stop-loss near the Spinning Top’s range.
8. How To Identify The High Wave Candlestick Pattern?
A High Wave Candle has long upper and lower wicks with a small real body. Traders confirm its reliability using volume analysis, RSI divergence and the next candle’s price movement.
We hope you’re clear on the topic, but there’s more to explore in stocks, commodities, mutual funds, and related areas. Here are important topics to learn about.
Disclaimer: The above article is written for educational purposes and the companies’ data mentioned in the article may change with respect to time The securities quoted are exemplary and are not recommendatory.





