


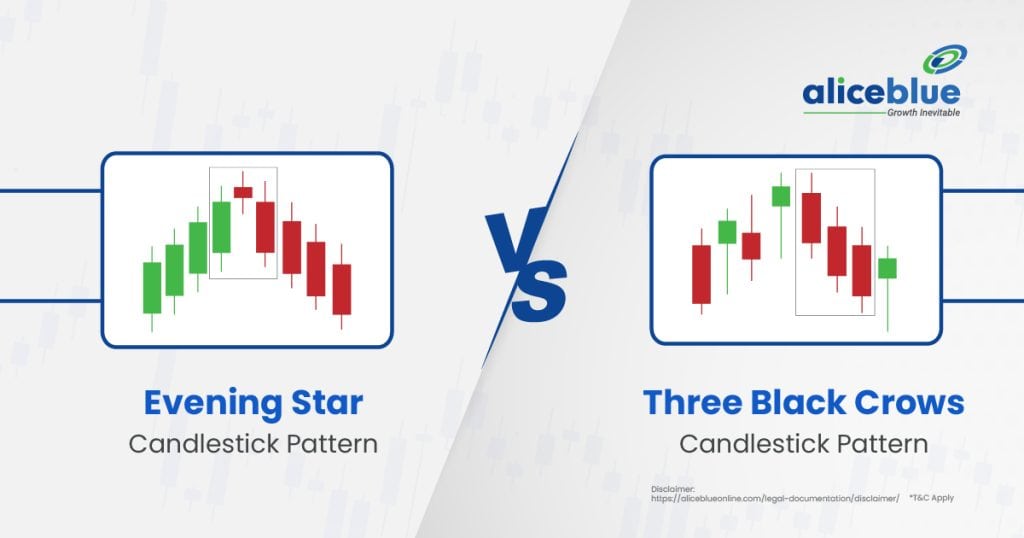
The Evening Star is a bearish reversal pattern after an uptrend, consisting of three candles, signaling a potential trend change. The Three Black Crows, also bearish, is formed by three consecutive long bearish candles, indicating strong downward momentum and sustained selling pressure.
Content:
- Evening Star Meaning
- Three Black Crows Meaning
- Difference Between Evening Star and Three Black Crows Candlestick Pattern
- Characteristics of Evening Star
- Characteristics of Three Black Crows
- How to Identify an Evening Star Pattern?
- How to Identify a Three Black Crows Candlestick Pattern?
- Trading Strategies for Evening Star
- Trading Strategies for Three Black Crows
- Difference Between Evening Star and Three Black Crows – Quick Summary
- Evening Star vs Three Black Crows Candlestick Pattern – FAQs
Evening Star Meaning
The Evening Star is a bearish reversal candlestick pattern that appears after an uptrend, signaling a potential trend change. It consists of three candles: a long bullish candle, a small-bodied candle (often a Doji), and a long bearish candle, indicating weakness.
This pattern suggests that buying pressure is fading, and sellers are starting to take control. Traders often watch for confirmation, such as a break below the third candle’s low, to confirm the bearish reversal and predict a shift toward a downtrend.

Three Black Crows Meaning
The Three Black Crows is a bearish reversal candlestick pattern, signaling a strong downtrend. It consists of three consecutive long bearish candlesticks, each closing lower than the previous one. This pattern shows sustained selling pressure and a shift to downward momentum.
This pattern suggests that the market is under heavy selling, and the buyers have lost control. Traders interpret this as a strong indication that further price declines are likely, making it a significant bearish signal when it occurs after an uptrend or consolidation.
Difference Between Evening Star and Three Black Crows Candlestick Pattern
The main difference between the Evening Star and Three Black Crows lies in their structure and trend context. The Evening Star is a reversal pattern that occurs after an uptrend, while the Three Black Crows appears within a downtrend, signaling continued bearish pressure.
| Aspect | Evening Star | Three Black Crows |
| Trend Context | Appears after an uptrend, indicating a potential bearish reversal. It signals a shift in market sentiment from buyers to sellers. | Occurs in a downtrend, reinforcing the bearish movement and suggesting further declines in the market. |
| Structure | Consists of three candles: a long bullish candle, a small-bodied candle (often a Doji), and a long bearish candle, signaling market weakness and a reversal. | Composed of three consecutive long bearish candles, each closing lower than the previous one, indicating strong downward momentum and sustained selling pressure. |
| Market Sentiment | Indicates that buying pressure is weakening, and sellers are beginning to dominate, suggesting a reversal from an uptrend to a downtrend. | Reflects strong selling pressure and a continued bearish trend, with sellers firmly in control and the price likely to continue declining. |
| Confirmation | Traders typically seek confirmation, such as a break below the low of the third candle, to validate the bearish reversal. | Traders look for continued bearish movement and increased volume to confirm that the market is likely to continue its downward trajectory. |
Characteristics of Evening Star
The main characteristics of the Evening Star pattern include its three-candle structure, where the first is a long bullish candle, followed by a small-bodied candle, and then a long bearish candle. It signals a potential bearish reversal after an uptrend.
- First Candle (Bullish): The first candle is a long bullish candlestick, indicating strong upward momentum and continued buying pressure. It marks the continuation of the uptrend and sets the stage for the potential reversal that follows.
- Second Candle (Small-bodied): The second candle is small and typically a Doji or indecisive candle, showing that buying momentum is starting to weaken. The small body indicates indecision in the market, with neither bulls nor bears in control.
- Third Candle (Bearish): The third candle is a long bearish candlestick, confirming the reversal. It closes well below the midpoint of the first candle, indicating that selling pressure has overwhelmed the previous buying strength and the trend is likely to shift.
- Trend Context: The pattern occurs after a strong uptrend, and its formation suggests that the previous upward momentum has weakened. Traders view the Evening Star as a signal that the market may soon reverse direction and move into a downtrend.
Characteristics of Three Black Crows
The main characteristics of the Three Black Crows pattern involve three consecutive long bearish candles, each closing lower than the previous one. This pattern indicates strong selling pressure, signaling the continuation of a downtrend and a potential bearish reversal in the market.
- Sequential Bearish Candles: The pattern consists of three consecutive long bearish candlesticks, each closing lower than the last. This shows sustained selling pressure, with each candle reinforcing the downtrend and indicating that sellers remain in control of the market.
- Strong Downward Momentum: Each of the three candles reflects a strong downward move, indicating that the market is heavily driven by bearish sentiment. The larger the candles, the more significant the signal, suggesting a more aggressive downtrend and continued selling pressure.
- Market Control by Sellers: The Three Black Crows pattern indicates that sellers have the upper hand, overpowering any attempts at a rally. The absence of bullish candles between the three bearish ones reinforces the idea of continuous selling and dominance of the downtrend.
- Reversal Signal after Uptrend: This pattern typically forms after an uptrend, suggesting a trend reversal. It signals that the market sentiment has shifted, with a strong indication that the bullish trend has ended and the market is likely to continue falling.
How to Identify an Evening Star Pattern?
To identify an Evening Star pattern, first look for a strong uptrend. The pattern consists of three candles: a long bullish candle, followed by a small-bodied candle (often a Doji), and then a long bearish candle signaling a potential reversal.
The key to confirming an Evening Star is the third candle, which should close well below the midpoint of the first candle. This bearish candle confirms that selling pressure has increased and signals the possibility of a downtrend, making the pattern a reliable bearish reversal indicator.

How to Identify a Three Black Crows Candlestick Pattern?
To identify a Three Black Crows pattern, look for three consecutive long bearish candlesticks. Each candle should close lower than the previous one, signaling sustained downward momentum. The pattern typically appears after an uptrend, indicating a potential bearish reversal.
The key to confirming the Three Black Crows pattern is the strength of each bearish candle. Longer candles with larger bodies suggest strong selling pressure, and the lack of any bullish candles between the three reinforces the bearish sentiment, confirming the continuation of the downtrend.

Trading Strategies for Evening Star
The main trading strategies for the Evening Star pattern involve waiting for confirmation before entering a short position. Traders look for a break below the third candle’s low, indicating a confirmed bearish reversal, and use risk management techniques to manage potential losses.
- Wait for Confirmation: Traders should wait for the price to break below the low of the third candle before entering a trade. This confirms the reversal and ensures that the bearish trend is likely to continue, reducing the risk of false signals.
- Stop Loss Placement: Place a stop loss above the high of the third candle to protect against potential market retracements. This provides a buffer in case the reversal fails and the price moves back in the original trend direction.
- Use of Indicators: Combine the Evening Star pattern with other technical indicators, such as RSI or MACD, to confirm the bearish signal. These indicators can help verify the strength of the reversal and enhance trade accuracy by showing overbought conditions or momentum shifts.
- Targeting Support Levels: Set price targets near previous support levels or Fibonacci retracement levels. These zones act as potential price reversal points where the downtrend might stall, allowing traders to lock in profits when the market reaches these areas.
Trading Strategies for Three Black Crows
The main trading strategies for the Three Black Crows pattern focus on confirming strong selling pressure before entering a short position. Traders should wait for confirmation and utilize risk management tools, such as stop losses, to minimize potential losses from false signals.
- Confirmation of Downtrend: Traders should wait for the price to break below the low of the third candle to confirm the continuation of the bearish trend. This ensures the downtrend is likely to persist, reducing the chances of a false reversal signal.
- Stop Loss Management: Place stop losses above the high of the third candle to limit potential losses. This protects against sudden price retracements, especially in volatile markets, and helps manage risk if the market reverses unexpectedly.
- Trend Confirmation Indicators: Use indicators like moving averages or the Relative Strength Index (RSI) to confirm the trend’s strength. A declining RSI or a price below a key moving average can add confidence to the bearish signal provided by the Three Black Crows pattern.
- Profit-Taking Levels: Set profit-taking targets at key support zones, such as previous lows or Fibonacci retracement levels. These levels often act as reversal points, allowing traders to lock in profits before the market potentially reverses or consolidates.
Difference Between Evening Star and Three Black Crows – Quick Summary
- The Evening Star is a bearish reversal pattern that signals a potential downtrend after an uptrend. It consists of three candles: a bullish candle, a small-bodied candle, and a bearish candle, indicating market weakness.
- The Three Black Crows pattern consists of three consecutive long bearish candles, each closing lower than the previous one. It signals strong selling pressure and the continuation of a downtrend, indicating further declines in the market.
- The Evening Star occurs after an uptrend and signals a bearish reversal, while the Three Black Crows appears during a downtrend and signals a continuation of the bearish move, indicating strong downward momentum.
- The Evening Star consists of three candles: a long bullish candle, a small-bodied candle, and a long bearish candle. It occurs after an uptrend and signals a shift from buying pressure to selling pressure, suggesting a reversal.
- The Three Black Crows pattern consists of three consecutive long bearish candles. Each closes lower than the previous one, indicating sustained selling pressure, and typically forms after an uptrend, signaling a continuation of the bearish trend.
- To identify an Evening Star, look for a strong uptrend followed by three candles: a bullish candle, a small-bodied candle, and a bearish candle. The third candle confirms a reversal and signals a potential price decline.
- The Three Black Crows pattern can be identified by three consecutive long bearish candles. Each candle closes lower than the previous one, signaling strong selling pressure and suggesting the continuation of a downtrend.
- For the Evening Star pattern, wait for confirmation by a break below the third candle’s low. Use stop losses above the third candle’s high and combine with indicators like RSI for greater accuracy and confirmation of the reversal.
- For the Three Black Crows, confirm the bearish trend by waiting for a break below the third candle’s low. Place stop losses above the third candle’s high and use additional indicators to verify the strength of the trend.
- Open a free demat account with Alice Blue in 15 minutes today! Invest in Stocks, Mutual Funds, Bonds & IPOs for Free. Also, trade at just ₹ 20/order brokerage on every order.

Evening Star vs Three Black Crows Candlestick Pattern – FAQs
1. What Is The Difference Between Evening Star and Three Black Crows?
The main difference between the Evening Star and Three Black Crows is that the Evening Star is a three-candle bearish reversal pattern with a gap, while Three Black Crows consists of three consecutive long bearish candles, signaling a strong downtrend without gaps between sessions.
2. What Is An Evening Star Pattern?
An Evening Star is a bearish candlestick pattern that indicates a potential trend reversal. It consists of three candles: a long bullish candle, followed by a small-bodied candle (usually a Doji), and a long bearish candle, suggesting market weakness.
3. What Is Three Black Crows Meaning?
The Three Black Crows pattern is a bearish reversal pattern consisting of three consecutive long bearish candlesticks. It indicates a strong downtrend, showing that the market is being dominated by sellers, and suggests that further price declines may follow.
4. Is The Evening Star Pattern Reliable?
The Evening Star pattern is considered reliable when it appears after a strong uptrend, signaling a reversal. However, like all technical patterns, its reliability increases with confirmation from other indicators, volume analysis, or market context, reducing the likelihood of false signals.
5. What Happens After An Evening Star Pattern?
After an Evening Star pattern, a bearish reversal is expected, leading to a potential downtrend. Traders typically watch for confirmation with subsequent bearish price action, such as a break below the low of the pattern’s third candle, to confirm the trend change.
6. What Happens After A Three Black Crows Candlestick Pattern?
After a Three Black Crows pattern, the market often continues its downtrend, indicating strong selling pressure. The bearish signal suggests further declines, and traders typically look for confirmation through additional bearish price movement or volume increases before making trading decisions.
7. Is Three Black Crows A Stronger Signal Than Evening Star?
The Three Black Crows pattern is considered a stronger bearish signal than the Evening Star due to its three consecutive long bearish candlesticks, which indicate sustained selling pressure. While the Evening Star is reliable, Three Black Crows usually signifies a more aggressive downtrend.
8. What Does An Evening Star Pattern Indicate?
An Evening Star pattern indicates a potential bearish reversal after an uptrend. It suggests that the market’s upward momentum is weakening, and the price may soon start to fall, signaling a shift from buyers to sellers, making it a strong signal for traders.
9. What Is The Opposite Of The Three Black Crows Pattern?
The opposite of the Three Black Crows pattern is the Three White Soldiers pattern. While Three Black Crows signals a strong bearish reversal, Three White Soldiers represents a strong bullish reversal with three consecutive long bullish candles indicating continued upward momentum.
10. Can Evening Star and Three Black Crows Occur In Both Uptrends And Downtrends?
The Evening Star pattern occurs in uptrends, signaling a potential bearish reversal, while the Three Black Crows pattern appears in downtrends, indicating further bearish movement. Both patterns typically indicate a reversal, but their positions within trends differ, with opposite implications.
We hope you’re clear on the topic, but there’s more to explore in stocks, commodities, mutual funds, and related areas. Here are important topics to learn about.
Disclaimer: The above article is written for educational purposes and the companies’ data mentioned in the article may change with respect to time. The securities quoted are exemplary and are not recommendatory.





