


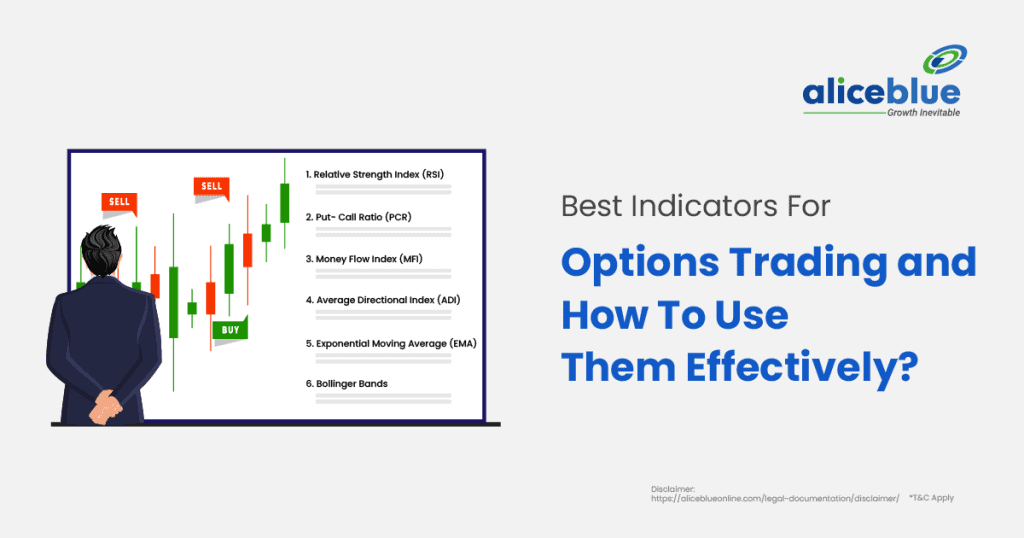
The best indicators for options trading include implied volatility, option Greeks, open interest, put-call ratio, and volume analysis. These indicators help traders assess market trends, manage risk, and optimize strategies, ensuring precise trade execution and improved profitability in dynamic market conditions.
Content:
- What Is Options Trading?
- What Are Options Trading Indicators?
- Importance Of Options Trading Technical Indicators
- Best Indicators For Options Trading
- Reasons To Use Options Trading Indicators
- How To Use Option Trading Indicators Effectively?
- Common Mistakes When Using Indicators In Options Trading
- Best Indicators For Options Trading – Quick Summary
- Best Indicators For Options Trading And How To Use Them Effectively – FAQs
What Is Options Trading?
Options trading involves buying and selling contracts that grant the right, but not the obligation, to buy or sell an asset at a predetermined price. Traders use options for hedging, speculation, and leveraging price movements while managing risk exposure effectively.
Options trading includes call-and-put options, allowing traders to profit from rising or falling prices without directly owning the asset. This flexibility helps traders navigate different market conditions and structure various strategies to maximize gains while minimizing risks.
Understanding key factors like expiration dates, strike prices, and market volatility is crucial. Traders analyze these elements alongside market sentiment and technical indicators to optimize their trading decisions and enhance profitability.
What Are Options Trading Indicators?
Options trading indicators help traders analyze market trends, volatility, and momentum. Key indicators include SMA (20), EMA (20), SMA (5), Supertrend, SMA (200), EMA (5), VWAP, Bollinger bands(20), EMA (200) and RSI (14) all of which provide critical insights for making informed and profitable trading decisions.
These indicators help traders evaluate price movements, assess liquidity, and measure market sentiment. Understanding their significance allows traders to select optimal strike prices, manage risk exposure, and time their trades effectively for better returns.
By integrating multiple indicators, traders improve accuracy in predicting market behavior. Using a combination of technical and sentiment-based tools ensures more precise trade execution and strategic adjustments in fluctuating market conditions.

Importance Of Options Trading Technical Indicators
The main importance of options trading technical indicators lies in their ability to analyze market trends, volatility, and momentum. These indicators help traders assess risk, optimize entry-exit points, and refine strategies, ensuring precise trade execution and improved profitability in dynamic market conditions.
- Market Trend Analysis: Technical indicators help traders identify bullish or bearish trends, allowing them to time trades effectively. By analyzing price movements, traders can determine the best moments to enter or exit options positions for maximum profitability.
- Volatility Assessment: Indicators like implied volatility measure expected price fluctuations, helping traders select optimal strike prices. Understanding volatility ensures traders manage risk efficiently, adjust strategies accordingly, and take advantage of market swings for better returns.
- Momentum Confirmation: Indicators such as RSI and MACD help traders confirm trend strength and market momentum. This prevents premature trade entries or exits, ensuring traders act based on strong signals rather than speculative movements.
- Risk Management: Using option Greeks like delta, gamma, and theta, traders can measure price sensitivity, time decay, and volatility impact. These insights help manage risks effectively by adjusting positions according to changing market conditions.
- Entry and Exit Optimization: Indicators assist in determining precise entry and exit points by analyzing liquidity, volume, and price action. This ensures better trade execution, reducing losses and increasing the probability of profitable trades in fluctuating market conditions.
Best Indicators For Options Trading
The main indicators for options trading include SMA (20), EMA (20), SMA (5), Supertrend, SMA (200), EMA (5), VWAP, Bollinger Bands (20), EMA (200), and RSI (14). These indicators help traders analyze trends, volatility, momentum, and support-resistance levels for precise trade execution.
- SMA (20) – Simple Moving Average: SMA (20) smooths price trends over 20 periods, helping traders identify short-term market direction. It assists in spotting trend reversals and confirming trade entry-exit points for better decision-making.
- EMA (20) – Exponential Moving Average: EMA (20) reacts faster to price changes than SMA, making it useful for identifying trend strength. Traders use it to confirm price direction and filter out noise in volatile market conditions.
- SMA (5) – Short-Term Trend Indicator: SMA (5) helps traders capture immediate price movements. It works well with other moving averages to confirm breakout signals, making it effective for short-term options trading strategies.
- Supertrend – Trend Confirmation: Supertrend helps traders determine bullish or bearish trends based on price action and volatility. It acts as a strong indicator for placing stop-loss levels and identifying trend direction in options trading.
- SMA (200) – Long-Term Trend Indicator: SMA (200) is a widely used indicator to identify long-term trends. It helps traders confirm market direction and strong support-resistance levels for options trading strategies.
- EMA (5) – Short-Term Market Signal: EMA (5) quickly reacts to price changes, making it a useful indicator for identifying immediate trade opportunities. Traders use it for scalping and intraday trading in volatile markets.
- VWAP – Volume-Weighted Average Price: VWAP measures the average price considering trading volume. It helps traders assess market strength and determine optimal entry and exit points for options trading strategies.
- Bollinger Bands (20) – Volatility Indicator: Bollinger Bands (20) highlight price volatility by showing overbought and oversold conditions. Traders use it to identify breakouts and trend continuation or reversal points in options trading.
- EMA (200) – Long-Term Market Strength: EMA (200) provides insights into long-term price trends. It reacts faster than SMA (200), making it a valuable indicator for spotting trend reversals and confirming strong market movements.
- RSI (14) – Relative Strength Index: RSI (14) measures momentum and identifies overbought or oversold conditions. A reading above 70 suggests overbought levels, while below 30 indicates oversold conditions, helping traders make informed options trading decisions.
Reasons To Use Options Trading Indicators
The main reasons to use options trading indicators include analyzing market trends, assessing volatility, measuring risk exposure, and optimizing trade execution. These indicators help traders make data-driven decisions, improve timing, and enhance profitability while minimizing risks in dynamic market conditions.
- Analyzing Market Trends: Options trading indicators help identify bullish or bearish trends, allowing traders to make informed decisions. By understanding trend direction, traders can time their entries and exits effectively, improving trade execution and profitability.
- Assessing Volatility: Indicators like implied volatility track expected price fluctuations, helping traders gauge market sentiment. High IV suggests uncertainty, increasing option premiums, while low IV indicates stability, enabling better risk management and contract selection.
- Measuring Risk Exposure: Option Greeks such as delta, gamma, and theta help traders understand price sensitivity, time decay, and volatility impact. These insights assist in managing risk effectively and adjusting strategies to market conditions.
- Optimizing Trade Execution: Indicators like open interest and volume analysis provide insights into liquidity and market participation. Higher values ensure smoother trade execution, while lower values signal potential difficulty in entering or exiting positions efficiently.
- Enhancing Profitability: By using indicators to assess probabilities, traders can select the best options contracts, improve strike price selection, and minimize losses. This systematic approach ensures well-structured trades, leading to higher profitability over time.
How To Use Option Trading Indicators Effectively?
Using option trading indicators effectively requires combining multiple metrics to assess market conditions. Traders should analyze implied volatility, Greeks, and open interest to make informed decisions, improving trade timing and risk management strategies.
Tracking implied volatility helps determine fair option pricing and potential price swings. Monitoring delta, gamma, theta, and vega allows traders to adjust their positions and select contracts that align with their risk tolerance and market outlook.
Additionally, volume and open interest indicate liquidity and strength of market participation. By considering these factors, traders can refine their strategies, improve execution precision, and maximize potential profitability while minimizing unnecessary risks.
Common Mistakes When Using Indicators In Options Trading
One common mistake is relying on a single indicator without cross-verifying with others. Traders should combine different metrics like volatility, Greeks, and market sentiment to get a comprehensive view of market conditions before making trading decisions.
Another mistake is misinterpreting implied volatility, leading to incorrect pricing assumptions. High IV increases premiums, while low IV reduces costs, making it essential for traders to understand how volatility impacts contract selection and overall strategy.
Overcomplicating strategies with too many indicators can cause confusion and poor execution. Instead, traders should focus on relevant data points, simplify their approach, and refine strategies based on key indicators to enhance trade accuracy and profitability.
Best Indicators For Options Trading – Quick Summary
- The best indicators for options trading include implied volatility, option Greeks, open interest, put-call ratio, and volume analysis. These tools help traders assess market trends, manage risk, and enhance trade execution for better profitability in dynamic conditions.
- Options trading involves contracts granting rights to buy or sell assets at fixed prices. Traders use options for hedging, speculation, and leveraging price movements while effectively managing risks to optimize returns in volatile financial markets.
- Options trading indicators analyze market trends, volatility, and momentum. Key indicators like implied volatility, option Greeks, open interest, and put-call ratio help traders make informed, data-driven decisions for improved profitability and risk management.
- The main importance of options trading indicators is in analyzing market trends, volatility, and momentum. These indicators refine strategies, optimize trade execution, and improve profitability while ensuring precise risk assessment in ever-changing market conditions.
- The main indicators for options trading include implied volatility, Greeks, open interest, put-call ratio, and volume analysis. They assist in measuring risk exposure, analyzing market sentiment, and improving trade execution for better decision-making in volatile markets.
- The main reasons to use options trading indicators are to assess market trends, measure volatility, optimize trade execution, and minimize risks. These tools enhance profitability by enabling traders to make precise, data-driven decisions in dynamic financial markets.
- Using options trading indicators effectively requires analyzing multiple metrics together. Traders should assess implied volatility, Greeks, and open interest to improve trade timing, reduce risk, and refine trading strategies for maximum profitability.
- One common mistake is relying on a single indicator without cross-verification. Traders should combine various metrics like volatility, Greeks, and market sentiment to develop a comprehensive market view before executing trading decisions.
Best Indicators For Options Trading And How To Use Them Effectively – FAQs
1. What Are The Best Indicators For Options Trading?
The main indicators for options trading include SMA (20), EMA (20), SMA (5), Supertrend, SMA (200), EMA (5), VWAP, Bollinger bands(20), EMA (200) and RSI (14). These indicators help traders assess market trends, manage risk, and optimize trade execution for better decision-making and profitability in dynamic market conditions.
2. Why Is Implied Volatility Important In Options Trading?
Implied volatility indicates expected market fluctuations, directly influencing option pricing. High IV increases premiums due to uncertainty, while low IV lowers costs. Traders use IV to identify opportunities, time trades effectively, and manage risk exposure in volatile market conditions.
3. What Is The Role Of Volume-Based Indicators In Trading Options?
The main role of volume-based indicators is to measure market participation, liquidity, and trend strength. High volume confirms strong interest and price movements, while low volume suggests weak momentum, helping traders determine optimal entry and exit points for better trade execution.
4. Can I Use Multiple Indicators At The Same Time?
Yes, traders often combine multiple indicators to get a comprehensive market view. Using implied volatility, option Greeks, and volume analysis together improves trade accuracy, minimizes risks, and enhances strategy execution for better profitability in different market conditions.
5. Which Time Frame Is Best For Option Trading?
The ideal time frame depends on the trading strategy. Short-term traders use 5- to 15-minute charts for intraday trades, while swing traders prefer daily charts. Longer time frames like weekly charts help identify broader trends for strategic options positioning.
6. How Do Technical Indicators Help In Options Trading?
Technical indicators help in options trading by identifying trends, volatility, and momentum shifts. With 1lyOptions, traders use indicators like RSI, Bollinger Bands, and MACD to optimize entry-exit points, manage risk, and execute data-driven trades with higher accuracy and profitability.
7. How Can Beginners Learn To Use Indicators Effectively?
Beginners should start with basic indicators like implied volatility, option Greeks, and volume analysis. Using demo accounts, backtesting strategies, and studying historical trends helps build confidence and improves understanding of how indicators influence options trading decisions.
We hope you’re clear on the topic, but there’s more to explore in stocks, commodities, mutual funds, and related areas. Here are important topics to learn about.
Disclaimer: The above article is written for educational purposes and the companies’ data mentioned in the article may change with respect to time. The securities quoted are exemplary and are not recommendatory.





