


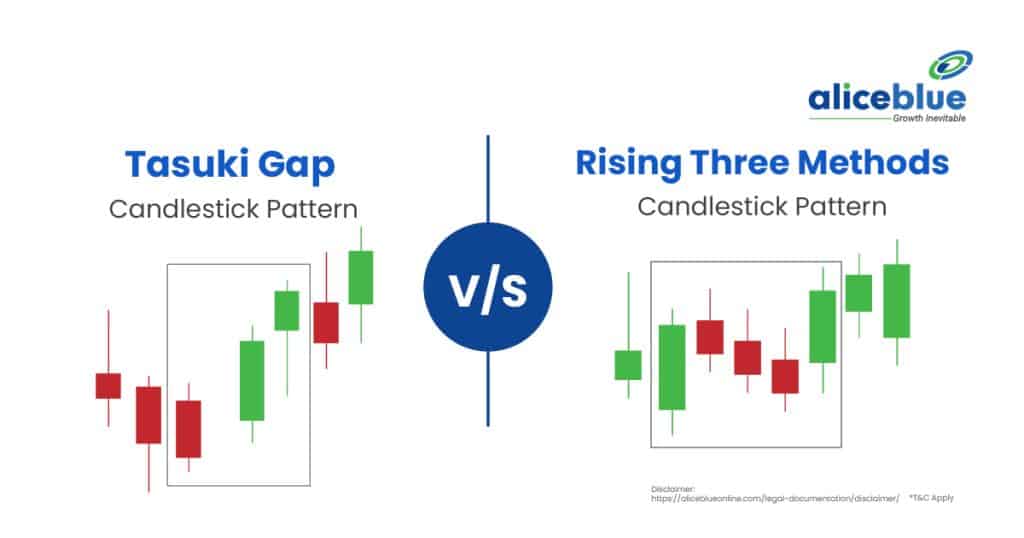
Tasuki Gap and Rising Three Methods are bullish continuation candlestick patterns. Tasuki Gap features a gap followed by a counter-trend candle while Rising Three Methods includes small consolidating candles. Both signal trend continuation, confirming market strength before resuming the prevailing uptrend.
Content:
- Tasuki Gap Meaning
- Rising Three Methods Meaning
- Difference Between Tasuki Gap and Rising Three Methods Candlestick Pattern
- Characteristics of Tasuki Gap
- Characteristics of Rising Three Methods
- How to Identify a Tasuki Gap Pattern?
- How to Identify a Rising Three Methods Candlestick Pattern?
- Trading Strategies for Tasuki Gap
- Trading Strategies for Rising Three Methods
- Difference Between Tasuki Gap and Rising Three Methods – Quick Summary
- Tasuki Gap vs Rising Three Methods Candlestick Pattern – FAQs
Tasuki Gap Meaning
Tasuki Gap is a continuation candlestick pattern that appears in strong trends, signalling sustained momentum. It consists of a gap in the trend’s direction, followed by a smaller opposite-coloured candle that fails to close the gap, reinforcing the prevailing bullish or bearish sentiment.
This pattern indicates that market participants remain committed to the trend, as the counter-trend candle’s inability to close the gap confirms strength. Traders use Tasuki Gap to validate ongoing trends, often alongside volume analysis and other technical indicators for stronger confirmation.

Rising Three Methods Meaning
Rising Three Methods is a bullish continuation candlestick pattern that signals a temporary pause before the uptrend resumes. It consists of a strong bullish candle, followed by three smaller bearish candles within its range and another strong bullish candle confirming trend continuation.
This pattern indicates controlled consolidation, where sellers attempt to push prices down but fail to reverse the trend. The final bullish candle confirms renewed buying pressure, making Rising Three Methods a reliable indicator of sustained upward momentum, especially in strong trending markets.
Difference Between Tasuki Gap and Rising Three Methods Candlestick Pattern
The main difference between Tasuki Gap and Rising Three Methods lies in their structure and confirmation. Tasuki Gap features a gap followed by a counter-trend candle failing to close the gap, while Rising Three Methods includes small consolidation candles within the trend, confirming sustained momentum before continuation.
| Aspect | Tasuki Gap | Rising Three Methods |
| Formation | A gap in the trend’s direction is followed by a smaller counter-trend candle that fails to close the gap. | A strong trend candle, three small opposite candles within its range, followed by another strong trend candle. |
| Confirmation | The failure to close the gap confirms trend continuation. | The final strong candle breaking past the consolidation confirms trend continuation. |
| Market Sentiment | Indicates strong momentum with minimal retracement. | Shows controlled consolidation before trend continuation. |
| Reliability | Reliable but needs volume confirmation to reduce false signals. | More reliable due to multiple confirmation candles, making it a stronger trend continuation pattern. |
Characteristics of Tasuki Gap
The main characteristic of the Tasuki Gap pattern is its occurrence within a strong trend, featuring a price gap followed by a counter-trend candle that fails to close the gap. This pattern confirms momentum and signals traders that the prevailing trend is likely to continue.
- Gap Formation: The pattern begins with a price gap in the direction of the trend. In a bullish Tasuki Gap, the price gaps up, while in a bearish Tasuki Gap, it gaps down. This signals strong market sentiment and increasing momentum in the prevailing direction.
- Counter-Trend Candle: A smaller opposite-coloured candle appears after the gap but does not close it. In a bullish Tasuki Gap, the counter-trend candle is bearish and in a bearish Tasuki Gap, it is bullish. This failure to close the gap confirms that the trend remains strong.
- Trend Continuation Signal: The pattern indicates that buyers in an uptrend or sellers in a downtrend remain dominant. Since the counter-trend candle does not fill the gap, it suggests that the temporary price pullback lacks strength, increasing the likelihood of the trend continuing.
- Volume Confirmation: The reliability of the Tasuki Gap improves when accompanied by high trading volume. Strong volume during the gap and subsequent price movement confirms strong market participation, reducing the risk of false signals and enhancing the pattern’s effectiveness in predicting trend continuation.
Characteristics of Rising Three Methods
The main characteristic of the Rising Three Methods pattern is its role as a bullish continuation signal, featuring a strong initial bullish candle, followed by three smaller bearish candles within its range and concluding with another strong bullish candle that confirms the trend’s continuation.
- Strong Initial Bullish Candle: The pattern begins with a large bullish candle, indicating strong buying momentum. This sets the foundation for the pattern, showing that buyers are in control and establishing a clear uptrend before a temporary consolidation phase takes place.
- Three Small Bearish Candles: After the initial surge, three consecutive small bearish candles appear within the range of the first candle. These candles signal a brief pullback, but since they remain contained within the first candle’s range, they indicate controlled selling pressure rather than a reversal.
- Final Bullish Confirmation Candle: The last candle in the pattern is another strong bullish candle that closes above the highest point of the first candle. This breakout confirms that buyers have regained control, validating the continuation of the uptrend and signalling a strong buying opportunity.
- Trend Continuation Signal: The pattern signifies a healthy uptrend with temporary consolidation, allowing weaker sellers to exit before the price resumes its upward movement. Since the bearish candles fail to break the initial bullish candle’s range, the pattern reinforces trend strength and reduces the chances of a reversal.
How to Identify a Tasuki Gap Pattern?
To identify a Tasuki Gap pattern, look for a strong trending market where a gap appears in the trend’s direction. In a bullish Tasuki Gap, the price gaps up, followed by a smaller bearish candle that does not close the gap, confirming continuation.
In a bearish Tasuki Gap, the price gaps are down, followed by a smaller bullish candle that fails to fill the gap. The key confirmation lies in the inability of the counter-trend candle to close the gap, signalling sustained momentum and trend continuation.

How to Identify a Rising Three Methods Candlestick Pattern?
To identify a Rising Three Methods pattern, look for a strong bullish candle, followed by three smaller bearish candles that stay within its range. These bearish candles indicate temporary consolidation without breaking the initial bullish candle’s low, showing controlled selling pressure.
The pattern completes with a final strong bullish candle that closes above the first candle’s high. This confirms that buyers have regained control, signalling trend continuation. The key to identification is ensuring the bearish candles remain inside the first candle’s range.

Trading Strategies for Tasuki Gap
The main trading strategy for the Tasuki Gap pattern involves identifying a strongly trending market where a price gap occurs, followed by a counter-trend candle that fails to close the gap. Traders use this pattern to confirm trend continuation and make informed entry and exit decisions.
- Entry After Confirmation: Wait for the counter-trend candle to form and confirm that it does not close the gap. Enter a trade in the direction of the prevailing trend after a strong continuation candle appears, ensuring the pattern’s validity and minimizing false signals.
- Stop-Loss Placement: Place a stop-loss just below the gap in a bullish Tasuki Gap or above the gap in a bearish Tasuki Gap. This protects against unexpected reversals, ensuring minimal losses if the pattern fails to confirm trend continuation.
- Volume Analysis: Confirm the pattern with volume analysis. Higher volume during the gap and continuation phase strengthens the pattern’s reliability, indicating strong market participation and reducing the chances of a false breakout or reversal.
- Profit-Taking Strategy: Set profit targets based on resistance or support levels, Fibonacci extensions, or previous price action trends. Adjust trailing stops to lock in profits as the trend continues, ensuring maximum gains while reducing exposure to potential market reversals.
Trading Strategies for Rising Three Methods
The main trading strategy for the Rising Three Methods pattern involves identifying a strong uptrend where a temporary consolidation occurs before the trend resumes. Traders use this pattern to confirm bullish momentum and strategically plan their entries, stop-loss placements and profit-taking levels for effective trade execution.
- Entry Timing: Enter a trade after the final bullish candle closes above the high of the first candle. This confirms that buyers have regained control and ensures a lower risk of false breakouts, increasing the probability of a successful bullish continuation.
- Risk Management: Place a stop-loss below the lowest point of the consolidation phase. This protects against potential reversals while allowing the trade enough room to develop, minimizing premature exits in case of minor pullbacks or market fluctuations.
- Volume Confirmation: Analyze trading volume to validate the pattern. A higher volume on the initial and final bullish candles strengthens the pattern’s reliability, indicating strong buyer participation and reducing the chances of a failed breakout.
- Profit-Booking Strategy: Use key resistance levels, Fibonacci extensions, or previous swing highs to set profit targets. Consider using a trailing stop-loss to lock in profits as the trend continues, ensuring a balance between maximizing gains and managing downside risk effectively.
Difference Between Tasuki Gap and Rising Three Methods – Quick Summary
- The Tasuki Gap is a continuation candlestick pattern occurring in an uptrend or downtrend. It features a price gap followed by a counter-trend candle that fails to close the gap, confirming trend strength.
- The Rising Three Methods is a bullish continuation pattern with a strong initial bullish candle, three small bearish candles within its range and a final bullish candle that breaks above the first candle, confirming uptrend continuation.
- The Tasuki Gap involves a price gap and a counter-trend candle that fails to close it, signalling trend continuation. The Rising Three Methods features consolidation within a strong trend before resuming upward momentum with a breakout candle.
- The Tasuki Gap pattern includes a price gap in the trend direction, a counter-trend candle that does not close the gap, and a continuation signal and volume confirmation, ensuring strong market participation and trend sustainability.
- The Rising Three Methods pattern consists of a strong initial bullish candle, three small bearish candles within its range, a final bullish breakout candle and a signal for trend continuation with controlled consolidation before resuming upward movement.
- Look for a price gap in a strong trend, followed by a counter-trend candle that does not close the gap. The inability to fill the gap confirms the pattern, signalling that the trend is likely to continue.
- To identify the Rising Three Methods pattern, look for a strong bullish candle, followed by three smaller bearish candles within its range. The pattern confirms when a final bullish candle closes above the first candle’s high, signalling bullish momentum and trend continuation.
- For the Tasuki Gap pattern, enter after confirming that the counter-trend candle does not close the gap. Use a stop-loss below or above the gap, validate the pattern with volume analysis and set profit targets based on resistance, support, or trailing stops to maximize gains.
- Enter after the final bullish candle closes above the first candle’s high, set stop-loss below the lowest consolidation point, confirm with volume analysis and establish profit targets using resistance levels, Fibonacci extensions, or trailing stops for effective risk management.
- Open a free demat account with Alice Blue in 15 minutes today! Invest in Stocks, Mutual Funds, Bonds & IPOs for Free. Also, trade at just ₹ 20/order brokerage on every order.

Tasuki Gap vs Rising Three Methods Candlestick Pattern – FAQs
1. What Is The Difference Between Tasuki Gap and Rising Three Methods?
Tasuki Gap and Rising Three Methods are continuation patterns, but Tasuki Gap involves a gap followed by a counter-trend candle while Rising Three Methods features small consolidating candles within a trend. Tasuki Gap confirms momentum, whereas Rising Three Methods indicates a temporary pause before continuation.
2. What Is A Tasuki Gap Pattern?
A Tasuki Gap pattern is a continuation candlestick formation that occurs in strong trends. It consists of a gap followed by a smaller candle moving against the trend but failing to close the gap. This signals that the prevailing trend is likely to continue.
3. What Is Rising Three Methods Meaning?
Rising Three Methods is a bullish continuation pattern comprising a strong bullish candle, three smaller bearish candles within its range and another strong bullish candle. It indicates a brief consolidation before the uptrend resumes, confirming sustained buying pressure and trend strength.
4. Is The Tasuki Gap Pattern Reliable?
The Tasuki Gap pattern is a reliable continuation signal, especially when supported by strong volume. However, traders should confirm with additional indicators, as false signals may occur. The pattern works best in strong trending markets, reinforcing the likelihood of trend continuation.
5. What Happens After A Tasuki Gap Pattern?
After a Tasuki Gap pattern forms, the price usually continues in the prevailing trend direction. The small counter-trend candle failing to close the gap signals sustained momentum, leading to further movement in the trend’s favour, often accompanied by increased volume.
6. What Happens After A Rising Three Methods Candlestick Pattern?
Following a Rising Three Methods pattern, the trend usually resumes in the original direction. The consolidation phase allows traders to confirm strength before another strong bullish or bearish candle appears, reinforcing the continuation of the prevailing trend.
7. Is Rising Three Methods A Stronger Signal Than Tasuki Gap?
Rising Three Methods is considered stronger than Tasuki Gap due to its multi-candle formation, showing a controlled consolidation before resuming the trend. Tasuki Gap relies on a single counter-trend candle, making Rising Three Methods a more reliable confirmation of trend continuation.
8. What Does A Tasuki Gap Pattern Indicate?
The Tasuki Gap pattern indicates a continuation of the current trend, showing strong momentum. The inability of the counter-trend candle to close the gap confirms that buyers or sellers remain dominant, making it a bullish or bearish confirmation pattern depending on the trend.
9. What Is The Opposite Of The Rising Three Methods Pattern?
The opposite of the Rising Three Methods pattern is the Falling Three Methods. It appears in a downtrend and consists of a strong bearish candle, three smaller bullish candles within its range, followed by another strong bearish candle, confirming continuation of the downtrend.
11. Can The Tasuki Gap Pattern Occur In Both Bullish And Bearish Markets?
Yes, the Tasuki Gap pattern occurs in both bullish and bearish markets. A bullish Tasuki Gap appears in an uptrend, while a bearish Tasuki Gap forms in a downtrend. Both indicate trend continuation when the counter-trend candle fails to close the gap.
12. What Is The Significance Of The Gap In The Tasuki Gap Pattern?
The gap in the Tasuki Gap pattern is crucial as it represents strong market sentiment. It shows an aggressive move in the trend’s direction. When the counter-trend candle fails to close the gap, it confirms that momentum is intact, signalling trend continuation.
We hope you’re clear on the topic, but there’s more to explore in stocks, commodities, mutual funds, and related areas. Here are important topics to learn about.
Disclaimer: The above article is written for educational purposes and the companies’ data mentioned in the article may change with respect to time. The securities quoted are exemplary and are not recommendatory.





