


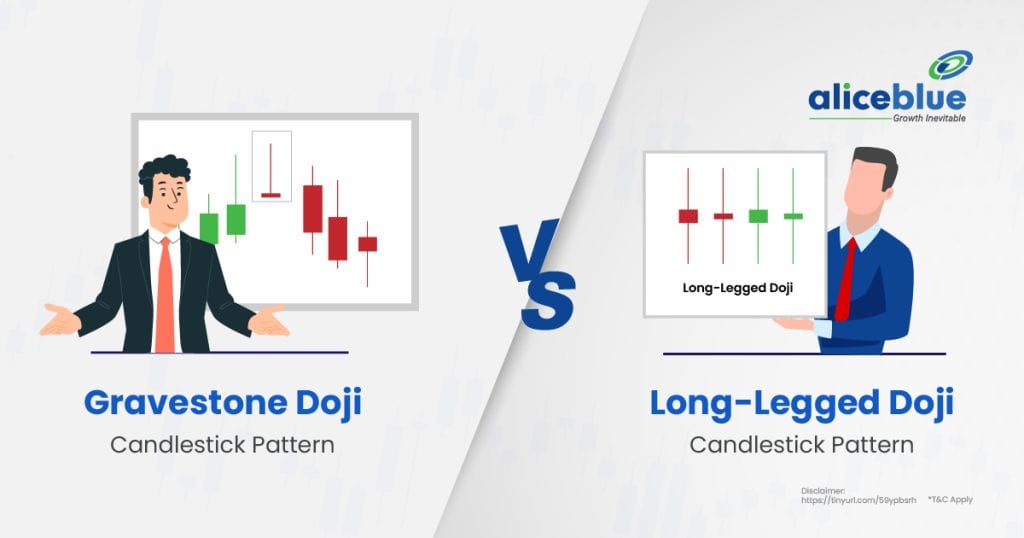
A Long-Legged Doji has long upper and lower wicks, showing strong market indecision, while a Gravestone Doji has a long upper wick and no lower wick, signaling bearish rejection. The Long-Legged Doji can appear in any trend, whereas the Gravestone Doji usually indicates a bearish reversal after an uptrend.
Content:
- Long-Legged Doji Meaning
- Gravestone Doji Meaning
- Difference Between Long-Legged Doji and Gravestone Doji Candlestick Pattern
- Characteristics of Long-Legged Doji
- Characteristics of Gravestone Doji
- How to Identify a Long-Legged Doji Pattern?
- How to Identify a Gravestone Doji Candlestick Pattern?
- Trading Strategies for Long-Legged Doji
- Trading Strategies for Gravestone Doji
- Difference Between Long-Legged Doji and Gravestone Doji – Quick Summary
- Long-Legged Doji vs Gravestone Doji Candlestick Pattern – FAQs
Long-Legged Doji Meaning

A Long-Legged Doji is a candlestick pattern that reflects strong market indecision. It has long upper and lower wicks with a nearly equal open and close price, indicating a battle between buyers and sellers without a clear direction.
This pattern appears in both uptrends and downtrends and signals potential trend reversals or continuations, depending on the next candle. When followed by a strong bullish or bearish move, it confirms market sentiment. Traders use RSI, MACD, and volume analysis to validate Long-Legged Doji signals before entering trades.

Gravestone Doji Meaning

A Gravestone Doji is a bearish reversal candlestick pattern that forms when the open, low, and close prices are nearly the same, with a long upper wick. It indicates that buyers tried to push prices higher, but sellers regained control, forcing the price to close near its opening.
This pattern commonly appears at the top of an uptrend, signaling a potential trend reversal. Traders confirm the pattern with volume analysis, resistance levels, and technical indicators like RSI and MACD before taking short positions or exiting long trades.
Difference Between Long-Legged Doji and Gravestone Doji Candlestick Pattern
A Long-Legged Doji and Gravestone Doji are candlestick patterns that indicate market indecision and potential reversals. The Long-Legged Doji has long wicks on both sides, while the Gravestone Doji has a long upper wick and no lower wick, signaling bearish rejection.
| Aspect | Long-Legged Doji | Gravestone Doji |
| Wick Formation | Long upper and lower wicks, showing strong indecision. | Long upper wick, no lower wick, signaling rejection. |
| Market Sentiment | Indicates uncertainty between buyers and sellers. | Suggests buyers lost control, and selling pressure increased. |
| Trend Appearance | Can appear in uptrends, downtrends, or sideways trends. | Typically forms at the top of an uptrend, signaling reversal. |
| Potential Outcome | May lead to continuation or reversal based on confirmation. | Often leads to a bearish reversal if confirmed by volume. |
| Confirmation Needed | Requires next candle confirmation for clear trend direction. | Needs a strong bearish follow-through candle for reliability. |
Characteristics of Long-Legged Doji
A Long-Legged Doji represents a market struggle between buyers and sellers, causing long wicks on both sides. It shows high volatility and uncertainty, often requiring confirmation for trend direction.
- Equal Open and Close Price
The opening and closing prices are nearly identical, forming a Doji, which signals market indecision with high price fluctuations. - Long Upper and Lower Wicks
The long wicks indicate strong buying and selling pressure, suggesting neither bulls nor bears have full control over price direction. - Appears in Any Trend
A Long-Legged Doji can occur in uptrends, downtrends, or sideways markets, making it an important pattern for traders watching potential reversals. - Needs Confirmation for Reliability
Traders use volume, RSI, and MACD to confirm if the pattern signals a reversal or continuation before making trading decisions.
Characteristics of Gravestone Doji
A Gravestone Doji signals a potential bearish reversal, appearing at the top of an uptrend when buyers fail to sustain higher prices.
- Long Upper Wick, Small or No Lower Wick
The long upper wick shows a failed attempt to push prices higher, while the closing near the opening signals selling pressure. - Often Found at Market Tops
This pattern is most effective when it appears after a strong uptrend, warning of potential price weakness. - Indicates Bearish Rejection
The Gravestone Doji suggests that buyers lost strength, and sellers gained control, increasing the chances of a price decline. - Requires Confirmation for Accuracy
A strong bearish candle following the Gravestone Doji confirms the reversal, ensuring a more reliable trade signal.
How to Identify a Long-Legged Doji Pattern?
A Long-Legged Doji is recognized by its long upper and lower wicks and nearly equal open and close price, signaling market indecision.
- Look for a Small or No Candle Body
The open and close prices are nearly identical, forming a Doji shape with long wicks on both sides. - Check for High Volatility
The large price swings indicate strong buyer-seller battles, creating long wicks without a clear trend direction. - Observe Its Position in a Trend
A Long-Legged Doji in an uptrend may signal hesitation, while in a downtrend, it could indicate a potential reversal. - Confirm with Volume and Indicators
Using volume, RSI divergence, or MACD crossovers increases accuracy in determining whether the pattern leads to a reversal or continuation.
How to Identify a Gravestone Doji Candlestick Pattern?
A Gravestone Doji is identified by a long upper wick, nearly equal open and close prices, and little to no lower wick, indicating a failed rally.
- Look for a Long Upper Wick
The long upper wick shows that buyers attempted to push prices higher but faced strong selling pressure. - Check the Closing Price
The closing price near the opening price confirms that buyers lost control, making it a potential bearish reversal signal. - Observe Trend Context
It is most effective at the top of an uptrend, signaling the possibility of trend exhaustion and reversal. - Confirm with Volume and Next Candle
A bearish candle after the Gravestone Doji confirms the reversal. High trading volume strengthens the pattern’s reliability.
Trading Strategies for Long-Legged Doji
A Long-Legged Doji signals indecision, so traders wait for confirmation before taking positions in bullish or bearish trades.
- Wait for the Next Candle
A strong bullish or bearish close after the Doji confirms the trade direction. - Use Stop-Loss Below/Above the Pattern
Setting a stop-loss below a bullish Doji or above a bearish Doji limits risk in volatile markets. - Combine with RSI and MACD
RSI divergence and MACD crossovers strengthen Doji-based trade setups, confirming entry points. - Trade Near Support and Resistance
A Doji at support suggests a bounce, while one at resistance indicates a reversal, improving trade accuracy.
Trading Strategies for Gravestone Doji
A Gravestone Doji is a bearish reversal signal, but traders must confirm it before entering short positions.
- Wait for a Bearish Confirmation Candle
A strong red candle after the Gravestone Doji validates the bearish reversal. - Use Stop-Loss Above the Wick
Placing a stop-loss above the Doji’s high prevents excessive losses if the pattern fails. - Confirm with Indicators
A falling RSI, MACD bearish crossover, or high volume on the reversal candle strengthens trade confidence. - Enter Trades at Resistance Levels
A Gravestone Doji at resistance increases bearish potential, making it an ideal shorting opportunity.
Difference Between Long-Legged Doji and Gravestone Doji – Quick Summary
- A Long-Legged Doji is a candlestick pattern with long upper and lower wicks, indicating strong market indecision. It signals that buyers and sellers struggled, resulting in a nearly equal open and close price, requiring confirmation for trend direction.
- A Gravestone Doji is a bearish reversal candlestick pattern with a long upper wick and nearly equal open and close prices. It suggests that buyers failed to maintain higher prices, and sellers gained control, signaling a potential downtrend.
- A Long-Legged Doji represents market uncertainty with equal open and close prices and long wicks on both sides. It appears in all trends and needs volume confirmation to determine whether it signals reversal or continuation.
- A Gravestone Doji has a long upper wick, nearly equal open and close prices, and no lower wick. It appears at the top of uptrends and signals a bearish reversal when confirmed by strong selling pressure.
- A Long-Legged Doji is identified by its long upper and lower wicks with a small or non-existent body. It signals market indecision, requiring confirmation through volume, RSI, and MACD for trade execution.
- A Gravestone Doji is identified by its long upper wick, small or no lower wick, and nearly equal open and close prices. It signals bearish pressure and requires confirmation through trend analysis and technical indicators.
- Open a free demat account with Alice Blue in 15 minutes today! Invest in Stocks, Mutual Funds, Bonds & IPOs for Free. Also, trade at just ₹ 20/order brokerage on every order.

Long-Legged Doji vs Gravestone Doji Candlestick Pattern – FAQs
1. What Is The Difference Between Long-Legged Doji and Gravestone Doji?
A Long-Legged Doji has long upper and lower wicks, indicating indecision, while a Gravestone Doji has a long upper wick and no lower wick, signaling a potential bearish reversal when appearing at the top of an uptrend.
2. What Is A Long-Legged Doji Pattern?
A Long-Legged Doji is a candlestick pattern with long wicks on both sides and a small or nonexistent body, reflecting strong market indecision between buyers and sellers, often requiring confirmation before making trading decisions.
3. What Is Gravestone Doji Meaning?
A Gravestone Doji is a bearish reversal pattern with a long upper wick and nearly equal open and close prices, showing that buyers lost strength and sellers pushed the price back down, indicating potential downward movement.
4. Is The Long-Legged Doji Pattern Reliable?
A Long-Legged Doji is reliable when confirmed with volume, RSI, and MACD. Alone, it signals market hesitation, but confirmation from trend continuation or reversal indicators increases its effectiveness in trading strategies.
5. What Happens After A Long-Legged Doji Pattern?
After a Long-Legged Doji, the market can continue, reverse, or consolidate, depending on the next candle’s confirmation. A bullish close suggests a continuation, while a bearish close signals a potential reversal in market direction.
6. What Happens After A Gravestone Doji Candlestick Pattern?
A Gravestone Doji often leads to a bearish reversal, especially if followed by a strong bearish candle. However, without confirmation, the price may consolidate or continue higher, requiring further analysis before taking a position.
7. Is Gravestone Doji A Stronger Signal Than Long-Legged Doji?
Yes, a Gravestone Doji is a stronger reversal signal than a Long-Legged Doji because it shows a clear rejection of higher prices, while a Long-Legged Doji only signals market indecision without a definitive trend direction.
8. What Does A Long-Legged Doji Pattern Indicate?
A Long-Legged Doji indicates high market uncertainty, with both buyers and sellers struggling for control. It signals potential trend continuation or reversal, depending on subsequent price action and confirmation signals.
9. What Is The Opposite Of The Gravestone Doji Pattern?
The opposite of a Gravestone Doji is a Dragonfly Doji, which has a long lower wick and no upper wick, indicating that sellers were overpowered by buyers, potentially signaling a bullish reversal.
10. Can Long-Legged Doji and Gravestone Doji Occur In Both Bullish And Bearish Markets?
Yes, both patterns can appear in bullish and bearish markets. A Long-Legged Doji can signal indecision anywhere, while a Gravestone Doji in an uptrend is bearish, but in a downtrend, it may indicate a temporary pause.
We hope you’re clear on the topic, but there’s more to explore in stocks, commodities, mutual funds, and related areas. Here are important topics to learn about.
Disclaimer: The above article is written for educational purposes, and the companies’ data mentioned in the article may change with respect to time The securities quoted are exemplary and are not recommendatory.





