


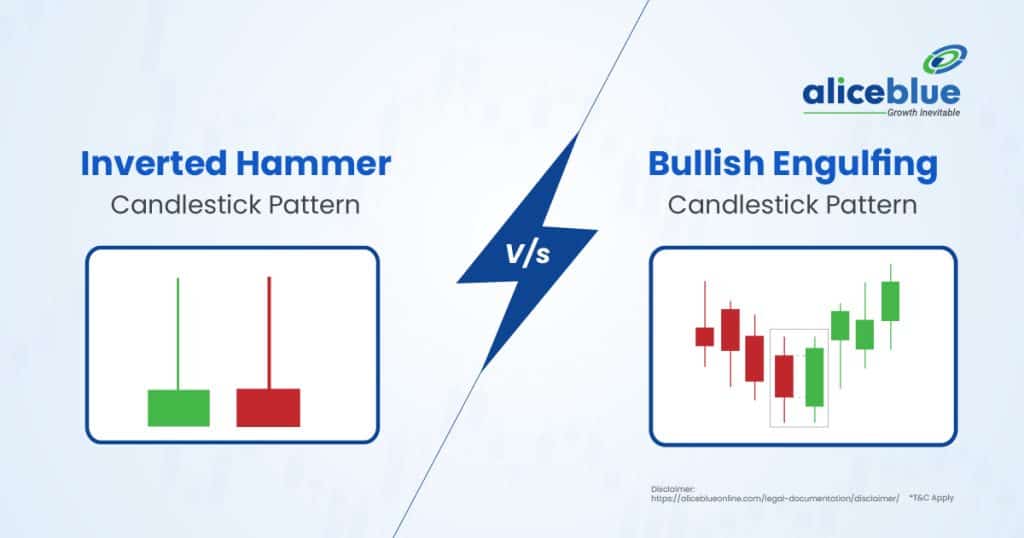
The Inverted Hammer and Bullish Engulfing are both bullish reversal patterns. The Inverted Hammer is a single candle indicating potential trend reversal after a downtrend, while the Bullish Engulfing is a two-candle pattern signaling stronger bullish momentum and trend shift.
Content:
- Inverted Hammer Meaning
- Bullish Engulfing Meaning
- Difference Between Inverted Hammer and Bullish Engulfing Candlestick Pattern
- Characteristics of Inverted Hammer
- Characteristics of Bullish Engulfing
- How to Identify an Inverted Hammer Pattern?
- How to Identify a Bullish Engulfing Candlestick Pattern?
- Trading Strategies for Inverted Hammer
- Trading Strategies for Bullish Engulfing
- Difference Between Inverted Hammer and Bullish Engulfing – Quick Summary
- Inverted Hammer vs Bullish Engulfing Candlestick Pattern – FAQs
Inverted Hammer Meaning
The Inverted Hammer is a bullish reversal pattern that appears after a downtrend. It consists of a small body near the session’s low, with a long upper shadow. The pattern signals potential buying interest, suggesting a reversal or pause in the downtrend.
This candlestick pattern indicates that despite strong selling pressure, buyers have started to push prices higher, as reflected by the long upper shadow. For confirmation, a higher close after the Inverted Hammer reinforces the reversal signal, indicating the potential start of an uptrend.

Bullish Engulfing Meaning
The Bullish Engulfing is a two-candle pattern that signals a potential trend reversal. The first candle is bearish, followed by a larger bullish candle that completely engulfs the body of the previous candle. This pattern indicates a shift from bearish to bullish momentum.
The Bullish Engulfing pattern suggests that buyers have overwhelmed the sellers, with the second candle closing higher than the opening of the previous bearish candle. It is often seen as a strong bullish signal, particularly when confirmed by higher volume or subsequent price increases.
Difference Between Inverted Hammer and Bullish Engulfing Candlestick Pattern
The main difference between the Inverted Hammer and Bullish Engulfing lies in their structure. The Inverted Hammer is a single-candle pattern signaling potential reversal after a downtrend, while the Bullish Engulfing is a two-candle pattern signaling a shift from bearish to bullish momentum.
| Aspect | Inverted Hammer | Bullish Engulfing |
| Pattern Structure | Consists of a single candle with a small body and a long upper shadow, indicating potential reversal. | Composed of two candles, where the second bullish candle completely engulfs the first bearish candle, signaling a trend shift. |
| Trend Context | Typically forms after a downtrend and suggests potential upward reversal. | Generally occurs after a downtrend, signaling a shift from bearish to bullish momentum. |
| Confirmation | Requires a higher close on the following candle for confirmation of the reversal. | The pattern is self-confirming as the second bullish candle engulfs the first, signaling a stronger reversal. |
| Strength | Weaker compared to Bullish Engulfing, as it is a single candle pattern needing further confirmation. | Stronger signal due to the engulfing nature, indicating a more significant momentum shift. |
Characteristics of Inverted Hammer
The main characteristics of the Inverted Hammer pattern include its small body near the session’s low and a long upper shadow. It appears after a downtrend and signals a potential reversal, indicating that buying pressure might be starting to outweigh the selling pressure.
- Small Body Near the Low: The Inverted Hammer has a small real body located near the low of the session, signifying that the open and close prices are close to each other. This reflects indecision and suggests a potential reversal after the downtrend.
- Long Upper Shadow: The long upper shadow indicates that, despite the initial bearish pressure, buyers managed to push the price higher during the session. This shows that the market might be shifting from a sell-off to a potential buying interest.
- Appears After a Downtrend: This pattern typically forms at the end of a downtrend, signaling a potential reversal. The Inverted Hammer suggests that downward momentum might be losing strength and that a bullish reversal could be on the horizon.
- Confirmation Required: The Inverted Hammer is considered more reliable when followed by a higher close in the next candle. A confirming candle closing above the Inverted Hammer’s high strengthens the signal and suggests a potential shift to an uptrend.
Characteristics of Bullish Engulfing
The main characteristics of the Bullish Engulfing pattern include two candles, where the second bullish candle completely engulfs the first bearish candle. It indicates a shift from selling pressure to buying pressure, signaling a potential reversal from a downtrend to an uptrend.
- Two-Candle Structure: The Bullish Engulfing pattern consists of two candles. The first is a small bearish candle, and the second is a large bullish candle that engulfs the first, indicating strong buying pressure overtaking the previous selling pressure.
- Engulfing Candle Size: The second candle in the pattern must completely engulf the body of the first candle, both in terms of open-close range. This indicates that the bulls have fully overpowered the bears, signaling a potential bullish reversal.
- Occurs After a Downtrend: Typically, the Bullish Engulfing pattern forms after a downtrend, suggesting a reversal of market sentiment. The appearance of this pattern indicates that the market may be shifting from bearish to bullish momentum.
- Bullish Confirmation: The strength of the Bullish Engulfing pattern lies in its ability to completely reverse the previous bearish movement. Confirmation of the pattern often comes with higher volume or subsequent bullish price movement, validating the shift in trend direction.
How to Identify an Inverted Hammer Pattern?
The Inverted Hammer pattern can be identified by its small body located near the session’s low, with a long upper shadow. This indicates that despite selling pressure during the session, buyers managed to push prices higher, signaling a potential reversal after a downtrend.
It typically forms after a downtrend and suggests that buying interest is starting to emerge. For confirmation, a higher close on the next candle is preferred, as it would signal that the reversal is gaining momentum and could lead to an upward trend.

How to Identify a Bullish Engulfing Candlestick Pattern?
The Bullish Engulfing pattern is identified by two candles: the first is a small bearish candle, followed by a larger bullish candle that completely engulfs the body of the first. This indicates that buyers have overpowered sellers, suggesting a trend reversal.
It typically forms after a downtrend, signaling a potential shift from bearish to bullish momentum. The larger second candle signifies strong buying pressure, and the pattern is considered reliable when accompanied by increased volume or further bullish price movement for confirmation.

Trading Strategies for Inverted Hammer
The main trading strategies for the Inverted Hammer pattern involve confirmation through the next candle’s close, as well as considering other factors like volume and trend context. Proper risk management and setting stop-loss levels are key to trading this pattern effectively.
- Wait for Confirmation: After the Inverted Hammer appears, wait for confirmation from the next candle closing higher. This confirms that the reversal is gaining momentum, increasing the probability of a bullish trend starting. Without confirmation, the pattern might fail, and the market could continue downward.
- Use Stop-Loss Orders: Set a stop-loss below the low of the Inverted Hammer to minimize risk. If the price continues lower after the pattern, the trade could be invalidated. This protects against larger losses if the reversal does not materialize.
- Volume Analysis: Increase the reliability of the Inverted Hammer by checking volume levels. Higher-than-average volume on the day the pattern forms, or on the confirmation candle, indicates stronger interest in the reversal, enhancing the probability of a trend shift.
- Trend Context: The Inverted Hammer is more reliable when it forms in a downtrend. Enter long positions only after confirming a bullish reversal to avoid catching false signals. Always consider the broader market context for the pattern’s effectiveness.
Trading Strategies for Bullish Engulfing
The main trading strategies for the Bullish Engulfing pattern focus on waiting for confirmation, managing risk, and using volume analysis to enhance reliability. Proper entry points and stop-loss placement can also help maximize returns while minimizing potential losses.
- Seek Confirmation with Higher Volume: For increased reliability, look for higher volume on the second bullish candle. This shows stronger buyer interest, confirming that the reversal is likely to continue. Avoid trading the pattern with low volume, as this may indicate a weak signal.
- Place Stop-Loss Below the Previous Low: After entering a trade based on the Bullish Engulfing pattern, place a stop-loss just below the low of the first bearish candle. This helps protect your position in case the trend doesn’t reverse as expected and the market turns bearish again.
- Wait for a Strong Close: Ensure the second bullish candle closes significantly above the first bearish candle’s high. A weak close or indecisive candlestick could signal a false breakout. A solid close provides confirmation that buying pressure has overtaken selling pressure.
- Consider Trend Direction: The Bullish Engulfing pattern is most reliable when it occurs after a downtrend, signaling a reversal to an uptrend. Avoid taking trades if the pattern appears during an established uptrend, as the pattern might not indicate a meaningful change in price direction.
Difference Between Inverted Hammer and Bullish Engulfing – Quick Summary
- The Inverted Hammer is a single candle pattern with a small body and a long upper shadow, signaling potential reversal after a downtrend. It indicates a shift in momentum from bearish to bullish.
- The Bullish Engulfing is a two-candle pattern where the second bullish candle completely engulfs the first bearish candle. This signals a reversal from a downtrend to an uptrend, suggesting that buying pressure has overpowered the sellers.
- The Inverted Hammer is a single candle pattern, while the Bullish Engulfing consists of two candles. The former signals potential reversal after a downtrend, and the latter indicates a stronger shift from bearish to bullish momentum.
- The Inverted Hammer has a small body at the bottom of the candle and a long upper shadow. It forms after a downtrend and suggests that buyers are gaining control, signaling a potential reversal if confirmed by the next candle.
- The Bullish Engulfing consists of two candles, where the second candle is a larger bullish one that engulfs the first bearish candle. It indicates a stronger shift in momentum from sellers to buyers, signaling a potential reversal.
- The Inverted Hammer appears after a downtrend and has a small body with a long upper shadow. It suggests that buyers are pushing prices up. Confirmation with a higher close in the next candle strengthens the reversal signal.
- The Bullish Engulfing pattern consists of two candles. The first is a small bearish candle, and the second is a large bullish candle that completely engulfs the first. It signals a shift in momentum from bearish to bullish.
- Trading the Inverted Hammer involves waiting for confirmation with a higher close, setting stop-loss below the low of the pattern, analyzing volume for strength, and ensuring the pattern forms in a downtrend for better reliability.
- For the Bullish Engulfing pattern, seek confirmation with higher volume, place a stop-loss below the first candle’s low, ensure a strong close on the second candle, and only trade in the context of a downtrend for reliable signals.
- Open a free demat account with Alice Blue in 15 minutes today! Invest in Stocks, Mutual Funds, Bonds & IPOs for Free. Also, trade at just ₹ 20/order brokerage on every order.

Inverted Hammer vs Bullish Engulfing Candlestick Pattern – FAQs
1. What Is The Difference Between Inverted Hammer and Bullish Engulfing?
The main difference between the Inverted Hammer and Bullish Engulfing is their structure. The Inverted Hammer is a single-candle pattern signaling potential reversal, while Bullish Engulfing is a two-candle pattern indicating a stronger bullish trend confirmation.
2. What Is An Inverted Hammer Pattern?
An Inverted Hammer is a single candlestick pattern that appears after a downtrend. It has a small body near the low of the session with a long upper shadow, signaling potential reversal or buying interest after downward momentum.
3. What Is Bullish Engulfing Meaning?
A Bullish Engulfing pattern is a two-candle reversal pattern. The first candle is bearish, and the second is a larger bullish candle that completely engulfs the first one. It signals a shift in momentum from bearish to bullish, indicating a potential uptrend.
4. Is The Inverted Hammer Pattern Reliable?
The Inverted Hammer can be reliable when confirmed by the next candle closing higher than its opening price. It signals a potential reversal after a downtrend, but confirmation is key, as it may not always lead to a sustained upward movement.
5. What Happens After An Inverted Hammer Pattern?
After an Inverted Hammer, if confirmed by a higher close, the market often shifts upward, indicating a potential reversal. However, if the following candle closes lower, the pattern might fail, and the downtrend could continue, so confirmation is crucial.
6. What Happens After A Bullish Engulfing Candlestick Pattern?
After a Bullish Engulfing pattern, a shift in market sentiment is expected, signaling the start of a potential uptrend. Traders often follow this pattern with confirmation, like volume increase or further bullish price action, to ensure the trend continues.
7. Is Bullish Engulfing A Stronger Signal Than Inverted Hammer?
The Bullish Engulfing pattern is generally considered a stronger signal than the Inverted Hammer. The two-candle pattern shows more commitment to a trend reversal, while the Inverted Hammer is a single-candle pattern that requires additional confirmation for reliability.
8. What Does An Inverted Hammer Pattern Indicate?
The Inverted Hammer indicates that despite downward pressure, there is buying interest, as shown by the long upper shadow. It suggests potential market reversal or trend exhaustion after a downtrend, signaling that buyers may be stepping in.
9. What Is The Opposite Of The Bullish Engulfing Pattern?
The opposite of the Bullish Engulfing pattern is the Bearish Engulfing pattern. This two-candle reversal pattern occurs after an uptrend and signals a shift in momentum, with the second candle completely engulfing the first bearish candle, indicating a potential downtrend.
10. Can Inverted Hammer and Bullish Engulfing Occur In Both Uptrends And Downtrends?
The Inverted Hammer generally occurs in downtrends, signaling a potential reversal to the upside, while the Bullish Engulfing pattern typically forms after a downtrend. However, both patterns can appear in various market conditions, but they are most significant after downtrends.
We hope you’re clear on the topic, but there’s more to explore in stocks, commodities, mutual funds, and related areas. Here are important topics to learn about.
Disclaimer: The above article is written for educational purposes and the companies’ data mentioned in the article may change with respect to time. The securities quoted are exemplary and are not recommendatory.





