


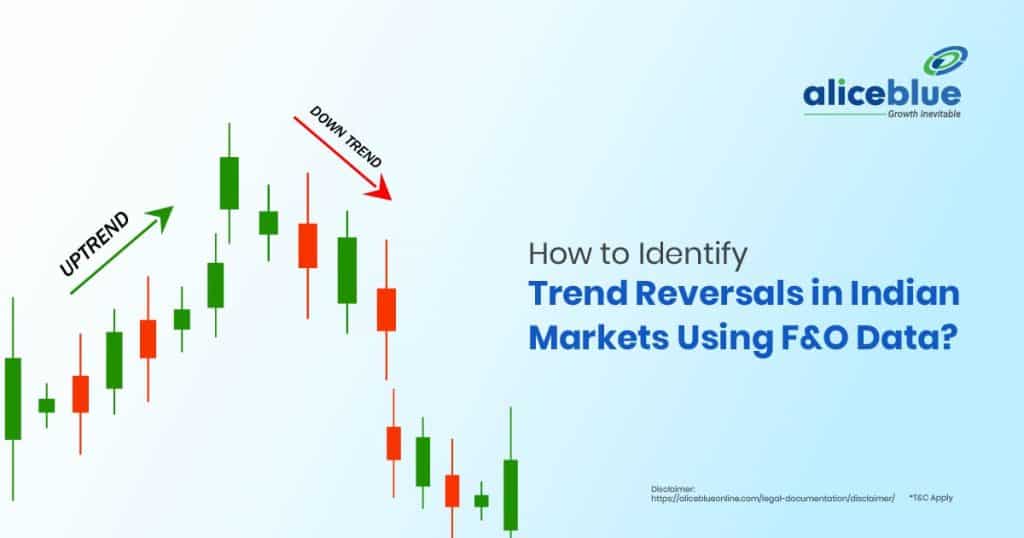
Identifying trend reversals in Indian markets using F&O data involves analyzing open interest, volume, RSI, MACD, and price action. A rise in open interest with declining prices signals bearish reversal, while increasing volume with price recovery confirms bullish trends. Combining technical indicators improves accuracy in F&O trading.
Content:
- Trend Reversal Meaning
- Futures & Options (F&O) Data Meaning
- Difference Between Trend Continuation and Trend Reversal
- Characteristics of Trend Reversals in Indian Markets
- How to Identify Trend Reversals Using F&O Data in Indian Markets?
- How to Identify Trend Reversals Using F&O Data? – Quick Summary
- Identifying Trend Reversals in Indian Markets Using F&O Data – FAQs
Trend Reversal Meaning
A trend reversal occurs when the existing market trend changes direction, signaling a shift from bullish to bearish or vice versa. It can happen due to fundamental factors, technical indicators, or changes in market sentiment, leading traders to adjust their strategies accordingly.
Traders use indicators like RSI, MACD, and moving averages to confirm trend reversals. A bearish reversal happens when a stock or index, after an uptrend, starts forming lower highs and lower lows. A bullish reversal occurs when a downtrend stabilizes, followed by higher highs and higher lows, indicating renewed buying interest.

Futures & Options (F&O) Data Meaning
Futures & Options (F&O) data provides insights into market sentiment, price trends, and institutional activity. By analyzing F&O contracts, traders can predict market movements based on changes in open interest, volume, and implied volatility, helping them make informed trading decisions.
A rise in open interest with falling prices indicates bearish sentiment, while rising open interest with increasing prices suggests bullish strength. A sudden drop in open interest signals trend exhaustion, helping traders anticipate potential reversals in Indian markets.
Difference Between Trend Continuation and Trend Reversal
Trend continuation occurs when the market moves in the same direction, while trend reversal signals a shift in momentum. Identifying key indicators like RSI, MACD, volume, and open interest helps traders make informed decisions.
| Aspect | Trend Continuation | Trend Reversal |
| Definition | Price moves in the same direction without major changes. | Price changes direction, signaling a shift in momentum. |
| Key Indicators | Higher highs, higher lows (uptrend) or lower lows (downtrend). | RSI divergence, MACD crossover, and volume spikes. |
| Open Interest (OI) Trend | OI rises with price in an uptrend, falls in a downtrend. | Rising OI with a price drop signals a bearish reversal. |
| Volume Confirmation | Volume remains stable or increases with trend continuation. | High volume at key levels confirms trend reversal. |
| Market Sentiment | Consistent bullish or bearish sentiment without major shifts. | Sudden changes in market sentiment drive reversals. |
Characteristics of Trend Reversals in Indian Markets
Trend reversals in Indian markets signal shifts in momentum, impacting stock prices. Identifying key indicators helps traders anticipate potential changes in market direction for strategic decision-making.
- Volume Spikes – Sudden increases in trading volume indicate a shift in market sentiment. High volumes during reversals suggest strong participation, confirming trend changes and potential price movements in stocks or indices.
- Divergence in Indicators – Technical indicators like RSI and MACD showing divergence from price movements signal weakening trends. If prices rise but the RSI declines, a bearish reversal might be forming.
- Breakout from Key Levels – A trend reversal often happens when stock prices break key resistance or support levels. A bullish reversal occurs if resistance is broken, while breaking support indicates bearish sentiment.
- Market Sentiment Shifts – News events, economic policies, or global factors influence market trends. A sudden change in investor sentiment, driven by earnings reports or macroeconomic factors, often leads to reversals.
How to Identify Trend Reversals Using F&O Data in Indian Markets?
Futures and options (F&O) data provide crucial insights into market sentiment, helping traders identify potential trend reversals through open interest, volume, and option chain analysis.
- Open Interest Changes – Rising open interest with price movement confirms trends, while declining open interest signals a reversal. Sudden unwinding in long or short positions suggests changing sentiment.
- Put-Call Ratio (PCR) Analysis – A high PCR (>1.5) indicates excessive bearish sentiment, signaling a possible uptrend. A low PCR (<0.5) suggests extreme bullishness, often preceding a trend reversal.
- Options Chain Analysis – Unusual activity in deep ITM or OTM strikes indicates potential reversals. Increasing call writing near resistance or put writing near support highlights changing market sentiment.
- IV and VIX Movement – Rising implied volatility (IV) and India VIX suggest uncertainty, often preceding reversals. A sharp IV spike during bullish or bearish trends signals possible trend exhaustion.
How to Identify Trend Reversals Using F&O Data? – Quick Summary
- A trend reversal occurs when the market direction shifts from bullish to bearish or vice versa. It is identified through price action, RSI, MACD, moving averages, and F&O data, helping traders anticipate changes in momentum and adjust their positions.
- F&O data provides insights into market sentiment by analyzing open interest (OI), volume, implied volatility (IV), and Put-Call Ratio (PCR). Traders use this data to predict trend reversals, breakouts, and potential price movements in the Indian markets.
- A trend continuation means the market sustains its current direction, while a trend reversal signals a shift in momentum. RSI divergence, OI changes, and PCR shifts help traders differentiate between continuation and reversal patterns in F&O trading.
- Trend reversals in Indian markets are marked by sharp price swings, RSI-MACD divergence, OI shifts, and rising IV levels. Traders monitor PCR, volume spikes, and resistance/support breakdowns to confirm potential market reversals.
- Traders use F&O data by analyzing OI trends, PCR fluctuations, IV spikes, and volume confirmation. Rising OI with falling prices signals bearish reversals, while increasing OI with price gains confirms bullish breakouts in the Indian markets.
- Open a free demat account with Alice Blue in 15 minutes today! Invest in Stocks, Mutual Funds, Bonds & IPOs for Free. Also, trade at just ₹ 20/order brokerage on every order.

Identifying Trend Reversals in Indian Markets Using F&O Data – FAQs
1. What Is a Trend Reversal?
A trend reversal occurs when a market shifts direction from bullish to bearish or vice versa. It is identified using technical indicators, price action, and F&O data analysis for confirmation.
2. How Can F&O Data Help in Identifying Trend Reversals?
F&O data helps traders spot trend reversals by analyzing open interest (OI), volume, implied volatility (IV), and Put-Call Ratio (PCR) to confirm changes in market sentiment and momentum.
3. What Are the Key Indicators in F&O Data to Watch for Trend Reversals?
Key indicators in F&O data for trend reversals include open interest trends, PCR changes, IV spikes, and volume surges. Rising OI with price drops signals a bearish reversal, while increasing OI with price gains confirms a bullish breakout.
4. How Reliable Is Open Interest in Predicting Trend Reversals?
Open interest (OI) is highly reliable when combined with price action. Rising OI with declining price signals bearish strength, while OI rising with price confirms a strong bullish trend in F&O trading.
5. Can Implied Volatility Signal Potential Trend Reversals?
Yes, implied volatility (IV) spikes indicate uncertainty. A sudden IV rise with price drops signals bearish pressure, while a falling IV with price gains suggests stable bullish sentiment in Indian markets.
6. What Role Does Volume Play in Confirming Trend Reversals?
High volume at support or resistance levels strengthens trend reversals. A breakout with low volume may indicate a false move, requiring further confirmation through OI and IV analysis.
7. How Do Institutional Traders Influence Trend Reversals in Indian Markets?
Institutional traders influence trend reversals by executing large F&O positions, triggering stop-loss hunting, and using high-volume trades to create liquidity traps that force retail traders into the wrong positions.
8. What Are the Risks of Trading Based on F&O Data?
The risks of trading based on F&O data include false signals from sudden market events, low liquidity, and misinterpretation of OI, IV, and PCR trends, potentially leading to losses in volatile markets.
9. Are There Specific Patterns in F&O Data Associated with Trend Reversals?
Yes, sharp OI changes, PCR shifts, IV spikes, and divergence in price and volume are common patterns signaling potential trend reversals in F&O trading strategies.
10. How Can I Develop a Strategy to Mitigate Risks Associated with Trend Reversals?
Use OI, IV, and PCR analysis with technical indicators like RSI and MACD, set stop-loss levels, and monitor institutional activity to minimize risks in F&O trend reversal trading.
We hope you’re clear on the topic, but there’s more to explore in stocks, commodities, mutual funds, and related areas. Here are important topics to learn about.
Disclaimer: The above article is written for educational purposes, and the companies’ data mentioned in the article may change with respect to time The securities quoted are exemplary and are not recommendatory.





