


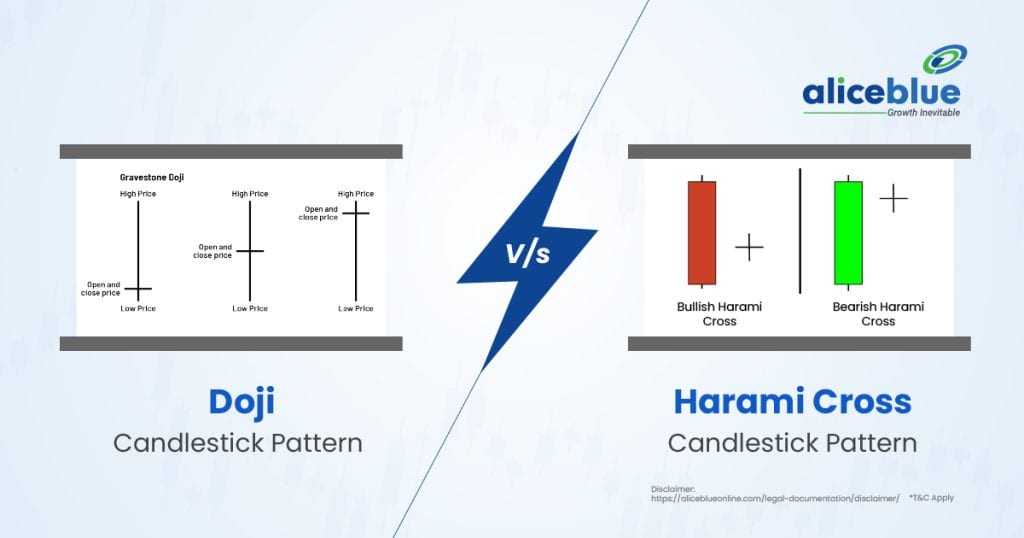
A Harami Cross is a two-candle pattern where a small Doji is completely inside the previous candle’s body, signaling indecision and possible reversal. A Doji is a single-candle pattern with nearly equal open and close prices, indicating market indecision and potential trend continuation or reversal.
Harami Cross Meaning

A Harami Cross is a two-candle candlestick pattern that signals market indecision and potential trend reversal. It consists of a large bullish or bearish candle followed by a small Doji, which is completely inside the previous candle’s body, indicating a loss of momentum.
This pattern appears after a strong trend and suggests a potential reversal or continuation, depending on market conditions. A bullish Harami Cross forms after a downtrend, hinting at a possible reversal, while a bearish Harami Cross appears after an uptrend, signaling weakness in buying pressure. Traders confirm it with volume and trend indicators.

Doji Meaning

A Doji is a single-candle pattern that represents market indecision. It forms when the open and close prices are nearly equal, creating a small or non-existent body with long or short wicks. It signals uncertainty between buyers and sellers.
Dojis can appear in different forms, such as Long-Legged Doji, Gravestone Doji, Dragonfly Doji, and Neutral Doji, each providing different trading insights. When appearing after a strong trend, a Doji may indicate trend exhaustion and a potential reversal if confirmed by volume and technical indicators.
Difference Between Harami Cross and Doji Candlestick Pattern
The main difference between the Harami Cross and Doji candlestick pattern is that the Harami Cross is a two-candle reversal pattern, while the Doji is a single-candle pattern indicating market indecision and trend uncertainty. Both suggest potential reversals but form differently.
| Aspect | Harami Cross | Doji Candlestick Pattern |
| Number of Candles | A two-candle pattern with a large candle followed by a Doji. | A single-candle pattern with nearly equal open and close prices. |
| Formation | The Doji appears inside the previous candle’s body, indicating trend hesitation. | Forms anywhere, signaling indecision and potential reversals or continuations. |
| Trend Context | Appears after an uptrend or downtrend, signaling a possible reversal. | Can appear in any trend but needs confirmation for reversal. |
| Market Sentiment | Indicates weakening momentum and potential reversal when confirmed with indicators. | Reflects market uncertainty, requiring additional confirmation from price action. |
| Reliability | More reliable when confirmed by volume and technical indicators. | Alone, it provides weak signals; needs trend analysis for accuracy. |
Characteristics of Harami Cross
The main characteristics of a Harami Cross include a large candlestick followed by a Doji entirely within the previous candle’s range. It signals trend exhaustion, market hesitation, and potential reversal as buyers and sellers show uncertainty in continuing the existing trend.
- Two-Candle Pattern
The first candle is large and shows strong momentum, while the second candle is a Doji, indicating uncertainty and a potential trend reversal. - Occurs After a Strong Trend
A bullish Harami Cross appears after a downtrend, signaling potential reversal, while a bearish Harami Cross forms after an uptrend, showing weakness. - Indecision Between Buyers and Sellers
The small Doji candle suggests a lack of direction, meaning buyers and sellers are uncertain about the next price movement. - Needs Confirmation for Reliability
Traders confirm the pattern with volume, RSI, MACD, or moving averages before making a trade decision to avoid false signals.
Characteristics of Doji
The main characteristics of a Doji include an almost equal open and close price, creating a small or nonexistent body with long or short wicks. It reflects market indecision, signaling potential reversals or trend continuation depending on its position.
- Represents Market Indecision
A Doji candle indicates buyers and sellers are in equilibrium, showing hesitation in market direction. - Varies in Formation
Types include Gravestone Doji, Dragonfly Doji, and Long-Legged Doji, each providing different trend insights. - Appears in Any Trend
A Doji in an uptrend signals a potential reversal, while a Doji in a downtrend can suggest a market bottom. - Needs Additional Confirmation
The Doji alone isn’t a strong signal; traders use volume, RSI, and MACD for validation before entering trades.
How to Identify a Harami Cross Pattern?
A Harami Cross pattern is identified by a large candle followed by a Doji inside its range. It signals market indecision and possible trend reversal when confirmed with technical indicators.
- Look for a Large Candle Followed by a Doji
The first candle is strong (bullish or bearish), while the second candle is a Doji, indicating hesitation. - Check for Trend Context
A bullish Harami Cross forms after a downtrend, signaling reversal, while a bearish Harami Cross appears after an uptrend, warning of a sell-off. - Confirm with Volume and Indicators
Volume decrease on the Doji candle confirms market hesitation while rising RSI or MACD crossovers strengthen the reversal signal. - Wait for the Next Candle
A strong bullish or bearish close after the Harami Cross confirms the trend reversal, helping traders make informed trade entries.
How to Identify a Doji Candlestick Pattern?
A Doji is identified by its small or nonexistent body with equal or long wicks, signaling market indecision. Traders look for trend context and volume confirmation to validate potential price action.
- Look for a Small Candle Body
The open and close prices are nearly identical, forming a Doji with long or short wicks, depending on market conditions. - Observe Its Position in a Trend
A Doji after an uptrend signals exhaustion, while a Doji after a downtrend suggests a possible price bottom. - Identify Doji Types
Dragonfly Doji has a long lower wick, Gravestone Doji has a long upper wick, and Long-Legged Doji has extended wicks on both sides. - Use Indicators for Confirmation
RSI divergence, MACD crossovers, or volume spikes help confirm whether a Doji signals a true reversal or just short-term market noise.
Trading Strategies for Harami Cross
The Harami Cross pattern signals a potential reversal. Traders use support/resistance levels, volume analysis, and technical indicators to confirm and trade this pattern effectively.
- Enter After Confirmation
Wait for the next candle after the Harami Cross to confirm reversal before entering a trade to avoid false breakouts. - Use Stop-Loss Above or Below the Pattern
Set a stop-loss above the bearish Harami Cross or below the bullish Harami Cross to manage risk effectively. - Combine with Technical Indicators
MACD crossovers, RSI divergence, or moving averages add reliability to the Harami Cross trade signals. - Trade at Key Support and Resistance Levels
A bullish Harami Cross near support strengthens reversal chances, while a bearish Harami Cross near resistance signals trend weakening.
Trading Strategies for Doji
A Doji candlestick suggests indecision, requiring additional confirmation. Traders use trend indicators, support/resistance, and volume analysis to execute profitable trades.
- Wait for Trend Confirmation
A Doji alone is weak, so traders wait for the next candle to confirm the trend direction before entering a trade. - Use Stop-Loss Below or Above the Doji
Setting a stop-loss below a bullish Doji or above a bearish Doji helps minimize risk if the trade goes against expectations. - Combine with Indicators for Accuracy
RSI overbought/oversold conditions, MACD crossovers, and Bollinger Bands improve Doji trading reliability. - Trade at Support and Resistance Zones
A Doji near key support indicates a possible bullish reversal, while a Doji at resistance signals potential bearish movement.
Difference Between Harami Cross and Doji – Quick Summary
- A Harami Cross is a two-candle pattern where a small Doji forms inside a large previous candle. It signals market indecision and potential trend reversal, depending on its position within an existing uptrend or downtrend.
- A Doji is a single-candle pattern with nearly equal open and close prices, indicating market uncertainty. It can suggest trend continuation or reversal, requiring confirmation from volume, RSI, or MACD for trading decisions.
- A Harami Cross features a large candle followed by a small Doji inside its body, showing weakening momentum. It appears after strong trends, signaling reversals when confirmed by volume and technical indicators.
- A Doji forms when opening and closing prices are nearly equal, creating a small or non-existent body. It signals market indecision, requiring additional confirmation from trend analysis and volume before making trading decisions.
- A Harami Cross is identified by a large candle followed by a Doji inside its range. It signals trend hesitation and is confirmed with support/resistance levels, volume changes, and momentum indicators.
- A Doji is identified by its small body and long wicks, reflecting market indecision. Traders observe its position in the trend and confirm reversals with RSI divergence, MACD crossovers, and volume analysis.
- Open a free demat account with Alice Blue in 15 minutes today! Invest in Stocks, Mutual Funds, Bonds & IPOs for Free. Also, trade at just ₹ 20/order brokerage on every order.

Harami Cross vs Doji Candlestick Pattern – FAQs
What Is The Difference Between Harami Cross and Doji?
The main difference between Harami Cross and Doji is that Harami Cross is a two-candle reversal pattern with a Doji inside a large candle, while Doji is a single candle indicating market indecision requiring confirmation.
What Is A Harami Cross Pattern?
A Harami Cross consists of a large candle followed by a Doji inside its range, signaling trend hesitation and potential reversal in uptrends or downtrends.
What Is Doji Meaning?
A Doji is a single-candle pattern with nearly equal open and close prices, representing market indecision and requiring further confirmation for trend direction.
Is The Harami Cross Pattern Reliable?
The Harami Cross is reliable when confirmed with volume, RSI, MACD, or trendline support/resistance, reducing the chances of false reversals in volatile markets.
What Happens After A Harami Cross Pattern?
After a Harami Cross, the price may reverse or continue consolidating. A strong next candle determines the actual trend direction.
What Happens After A Doji Candlestick Pattern?
After a Doji, the market often remains indecisive until the next candle confirms a continuation or reversal using technical indicators like volume and RSI.
Is Doji A Stronger Signal Than Harami Cross?
No, a Harami Cross is stronger because it forms within a trend, whereas a Doji alone requires confirmation for trend direction.
What Does A Harami Cross Pattern Indicate?
A Harami Cross indicates a slowdown in momentum, suggesting a possible trend reversal or continuation, depending on confirmation from the next candle.
What Is The Opposite Of The Doji Pattern?
The opposite of a Doji is a Marubozu candle, which has no wicks and signals strong momentum in either a bullish or bearish direction.
Can Harami Cross and Doji Occur In Both Uptrends And Downtrends?
Yes, both patterns can form in uptrends and downtrends. A bullish Harami Cross signals reversal in downtrends, while a bearish Harami Cross suggests weakness in uptrends.
We hope you’re clear on the topic, but there’s more to explore in stocks, commodities, mutual funds, and related areas. Here are important topics to learn about.
Disclaimer: The above article is written for educational purposes, and the companies’ data mentioned in the article may change with respect to time The securities quoted are exemplary and are not recommendatory.





