


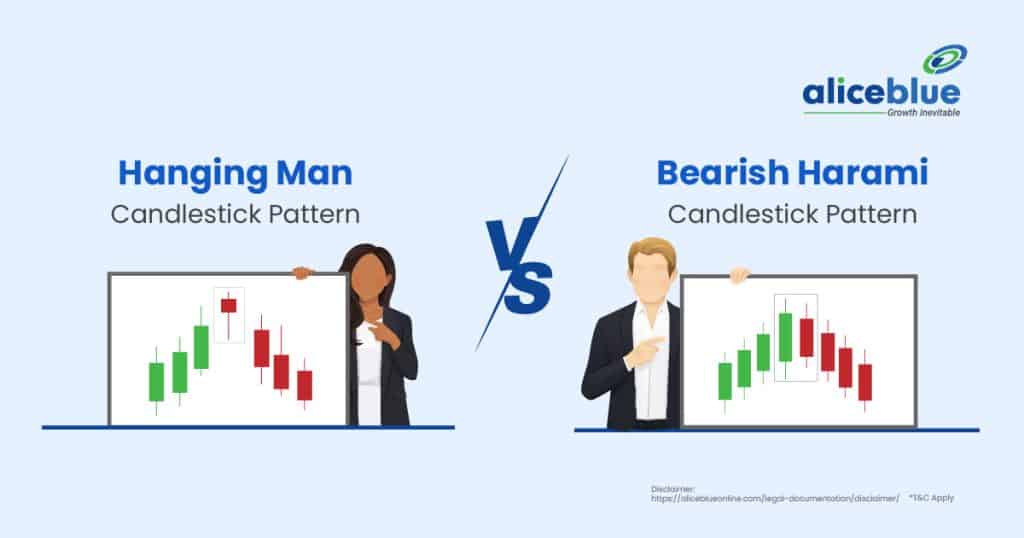
The main difference between the Hanging Man and Bearish Harami candlestick patterns lies in their structure and confirmation. A Hanging Man has a small body with a long lower wick, while a Bearish Harami consists of a small bearish candle within a preceding large bullish candle.
Hanging Man Meaning
The Hanging Man is a bearish reversal candlestick pattern that forms at the top of an uptrend. It has a small real body near the high, a long lower shadow and little or no upper wick, indicating potential selling pressure and trend reversal.
A Hanging Man suggests that buyers initially pushed prices higher, but sellers regained control, driving prices down before closing near the open. This shift in sentiment signals weakening bullish momentum and a possible trend reversal if confirmed by a bearish follow-up candle.
Traders rely on volume analysis and confirmation candles before acting on a Hanging Man. A strong bearish close following the pattern strengthens its validity, while high trading volume enhances its reliability as a potential signal for short positions.

Bearish Harami Meaning
A Bearish Harami is a two-candlestick bearish reversal pattern that appears after an uptrend. It consists of a large bullish candle followed by a smaller bearish candle that remains within the previous candle’s body, indicating a loss of bullish momentum and potential reversal.
This pattern suggests that buying pressure has weakened, as the second candle fails to sustain higher prices. It signals market indecision, with the possibility of a bearish reversal if the next candle closes lower, confirming downward momentum.
The Bearish Harami is more reliable when it appears near resistance levels or after prolonged uptrends. Traders often wait for additional bearish confirmation, such as a strong red candle or increased selling volume, before entering short positions.
Difference Between Hanging Man and Bearish Harami Candlestick Pattern
The main difference between the Hanging Man and Bearish Harami candlestick patterns is that Hanging Man is a single bearish reversal candle with a long lower wick, while a Bearish Harami is a two-candle pattern indicating weakening bullish momentum.
| Criteria | Hanging Man | Bearish Harami |
| Pattern Type | Single candlestick pattern | Two-candlestick pattern |
| Formation | Small real body near the high with a long lower wick | Large bullish candle followed by a smaller bearish candle inside its body |
| Trend Location | Appears at the top of an uptrend | Forms after an uptrend, signalling a potential reversal |
| Signal Strength | Requires confirmation from the next bearish candle | Indicates weakening bullish momentum, needs confirmation |
| Market Psychology | Buyers push prices higher but face strong selling pressure | Buyers lose control and sellers gain strength |
| Confirmation | A bearish close after the Hanging Man confirms the reversal | A strong bearish candle below the second candle’s low confirms the reversal |
| Common Use | Used for short-selling or profit booking in uptrends | Used for identifying trend reversals and entering short trades |
Characteristics of Hanging Man
The main characteristics of the Hanging Man include a small real body near the high, a long lower wick at least twice its body size, little or no upper shadow and its formation after an uptrend, signaling potential bearish reversal requiring confirmation from a strong follow-up candle.
- Small Real Body – The Hanging Man has a small real body near the high of the candlestick, indicating that buyers attempted to push prices higher but failed to maintain control, leading to potential selling pressure.
- Long Lower Wick – The pattern features a long lower wick at least twice the size of its real body, showing that sellers initially drove prices down before buyers attempted to recover but ultimately lost strength.
- Little or No Upper Shadow – A Hanging Man has minimal or no upper shadow, reinforcing the idea that the market failed to sustain higher prices, increasing the likelihood of a bearish reversal if confirmed by subsequent price action.
- Formation After an Uptrend – This pattern appears at the top of an uptrend, signalling potential weakness in bullish momentum. Its presence indicates that the trend may be reversing, but confirmation from the next candle is required.
- Confirmation Required – The Hanging Man alone does not confirm a reversal. A strong bearish candle closing below its low is necessary to validate the signal, making it a reliable bearish reversal indicator for traders.
Characteristics of Bearish Harami
The main characteristics of the Bearish Harami include a large bullish candle followed by a smaller bearish candle within its body, formation after an uptrend, signalling to weaken bullish momentum and requiring confirmation through a bearish follow-up candle to validate the potential reversal signal effectively.
- Two-Candle Pattern – The Bearish Harami consists of a large bullish candle followed by a smaller bearish candle within its body, indicating a potential reversal due to weakening buying pressure after a strong upward trend.
- Formation After an Uptrend – This pattern appears at the top of an uptrend, signalling that bullish momentum is fading. It suggests market indecision, where buyers lose strength and sellers may start gaining control.
- Smaller Bearish Candle Inside First Candle – The second candle is significantly smaller and remains within the body of the first bullish candle, highlighting reduced volatility and hesitation among buyers, which could indicate a potential shift in trend direction.
- Requires Confirmation – A Bearish Harami alone does not confirm a trend reversal. A strong bearish candle closing below the smaller candle’s low is needed to validate the pattern and signal a potential downtrend.
- Signals Weakening Bullish Momentum – The shrinking candle size represents reduced buyer confidence. This pattern suggests that the existing uptrend may be losing steam, making it a key indicator for traders seeking potential bearish reversal signals.
How to Identify a Hanging Man Pattern?
To identify a Hanging Man, look for a small real body at the high of an uptrend with a long lower shadow, at least twice the body’s size. The candle should have little or no upper wick, signalling possible selling pressure.
The Hanging Man forms when buyers initially drive prices higher, but strong selling pressure pulls them back down before closing. This pattern alone isn’t enough for confirmation, requiring a subsequent bearish candle to validate the reversal signal.
High trading volume strengthens the Hanging Man’s reliability. If the next candle closes below the Hanging Man’s low, it confirms bearish sentiment, providing a stronger entry signal for traders looking to capitalize on potential downward momentum.

How to Identify a Bearish Harami Candlestick Pattern?
To identify a Bearish Harami, look for a large bullish candle followed by a smaller bearish candle within its body. This pattern should appear at the top of an uptrend, signalling weakening bullish momentum and potential trend reversal.
A Bearish Harami forms when buyers fail to push prices higher, allowing sellers to take control. The smaller second candle indicates market indecision, suggesting that bullish strength is fading and a downward move could follow.
The pattern gains reliability when confirmed by a strong bearish candle closing below the smaller candle’s low. Traders often use resistance levels, moving averages, or other technical indicators to increase confidence in the Bearish Harami’s bearish signal.

Trading Strategies for Hanging Man
Traders enter short positions when the next candle after a Hanging Man closes below its low, confirming bearish sentiment. A stop-loss is set above the Hanging Man’s high and profit targets align with previous support levels for effective risk management.
Volume analysis helps validate the Hanging Man’s signal. A high-volume Hanging Man followed by a strong bearish close increases the likelihood of reversal, making it a more reliable setup for traders seeking short-term bearish trades.
Additional confirmation from indicators like RSI or moving averages strengthens the trade setup. If the RSI shows overbought conditions and the price rejects a resistance level, the Hanging Man’s bearish signal becomes more credible for initiating a short position.
Trading Strategies for Bearish Harami
Traders enter short positions after a Bearish Harami when the next candle closes below the pattern’s low, confirming bearish momentum. Stop-loss is placed above the first candle’s high, with profit targets set at prior support levels or Fibonacci retracement zones.
Bearish Harami gains strength when combined with resistance levels or technical indicators. If the pattern appears near a major resistance zone or moving average, it enhances its reliability as a bearish reversal signal for traders.
Traders use additional confirmation methods like MACD crossovers or volume analysis. A declining MACD histogram or increased selling volume after a Bearish Harami further supports bearish sentiment, making it a strong setup for short trades.
Difference Between Hanging Man and Bearish Harami – Quick Summary
- The main difference between the Hanging Man and Bearish Harami candlestick patterns lies in their structure. A Hanging Man is a single candle with a long lower wick, while a Bearish Harami is a two-candle pattern indicating weakening bullish momentum.
- The Hanging Man is a bearish reversal pattern forming at an uptrend’s peak. It has a small real body, a long lower wick and a little upper shadow, signalling selling pressure and a potential trend reversal requiring confirmation.
- A Bearish Harami is a bearish reversal pattern appearing after an uptrend. It consists of a large bullish candle followed by a smaller bearish candle within its body, indicating fading bullish momentum and potential trend reversal with confirmation.
- The main characteristics of the Hanging Man include a small body near the high, a long lower wick twice its body’s size, a little upper shadow and its formation after an uptrend, signalling potential reversal requiring a strong bearish confirmation.
- The main characteristics of the Bearish Harami include a large bullish candle followed by a smaller bearish candle, formation after an uptrend and signalling weakening bullish momentum, requiring a bearish follow-up candle to confirm the potential reversal effectively.
- To identify a Hanging Man, look for a small real body at an uptrend’s high with a long lower shadow, at least twice the body’s size and a little upper wick, signalling selling pressure and a potential bearish reversal.
- To identify a Bearish Harami, look for a large bullish candle followed by a smaller bearish candle within its body, forming at the top of an uptrend. This signals fading bullish momentum and a potential trend reversal with confirmation.
- Traders enter short positions when the next candle after a Hanging Man closes below its low, confirming bearish sentiment. A stop-loss is placed above the high and profit targets align with previous support levels for risk management.
- Traders enter short positions after a Bearish Harami when the next candle closes below the pattern’s low, confirming bearish momentum. A stop-loss is placed above the first candle’s high, with profit targets at prior support levels or Fibonacci retracement zones.
- Open a free demat account with Alice Blue in 15 minutes today! Invest in Stocks, Mutual Funds, Bonds & IPOs for Free. Also, trade at just ₹ 20/order brokerage on every order.

Hanging Man vs Bearish Harami Candlestick Pattern – FAQs
What Is The Difference Between Hanging Man and Bearish Harami?
The main difference between the Hanging Man and Bearish Harami lies in structure. A Hanging Man is a single candlestick with a long lower wick, while a Bearish Harami is a two-candle pattern indicating fading bullish momentum within a prior bullish candle.
What Is A Hanging Man Pattern?
A Hanging Man is a bearish reversal candlestick pattern that appears after an uptrend. It has a small real body near the high, a long lower wick and little or no upper shadow, indicating potential selling pressure and a possible trend reversal.
What Is Bearish Harami Meaning?
A Bearish Harami is a two-candlestick bearish reversal pattern formed after an uptrend. It consists of a large bullish candle followed by a smaller bearish candle within its body, signalling weakening bullish momentum and a potential reversal if confirmed by further bearish price action.
Is The Hanging Man Pattern Reliable?
The Hanging Man pattern is considered reliable when confirmed by the next candle closing below its low. Without confirmation, it remains a weak signal. Volume analysis and additional indicators strengthen its reliability as a bearish reversal pattern.
What Happens After A Hanging Man Pattern?
After a Hanging Man pattern, if the next candle closes below its low, it confirms bearish momentum, leading to a potential downtrend. Without confirmation, the uptrend may continue, making additional analysis essential before entering short positions.
What Happens After A Bearish Harami Candlestick Pattern?
After a Bearish Harami, the trend may reverse if the next candle confirms bearish momentum by closing below the pattern’s low. If bullish sentiment persists, the uptrend can continue, making further confirmation necessary before executing trades.
Is Bearish Harami A Stronger Signal Than Hanging Man?
The Bearish Harami is considered a stronger signal than the Hanging Man as it consists of two candles, indicating weakening bullish momentum. However, both require confirmation and their strength depends on market conditions, volume and additional technical indicators.
What Does A Hanging Man Pattern Indicate?
A Hanging Man pattern indicates that selling pressure is increasing after an uptrend. Buyers attempted to push prices higher, but sellers regained control, signalling potential bearish momentum if confirmed by a strong follow-up bearish candle.
What Is The Opposite Of The Bearish Harami Pattern?
The opposite of the Bearish Harami is the Bullish Harami, a two-candlestick pattern where a large bearish candle is followed by a smaller bullish candle within its body, signalling weakening selling pressure and a potential bullish reversal.
Can Hanging Man and Bearish Harami Occur In Both Uptrends And Downtrends?
No, Hanging Man and Bearish Harami patterns primarily occur after uptrends as bearish reversal signals. Their bullish counterparts, Hammer and Bullish Harami, form after downtrends, indicating potential reversals to the upside.
We hope you’re clear on the topic, but there’s more to explore in stocks, commodities, mutual funds, and related areas. Here are important topics to learn about.
Disclaimer: The above article is written for educational purposes and the companies’ data mentioned in the article may change with respect to time. The securities quoted are exemplary and are not recommendatory.





