


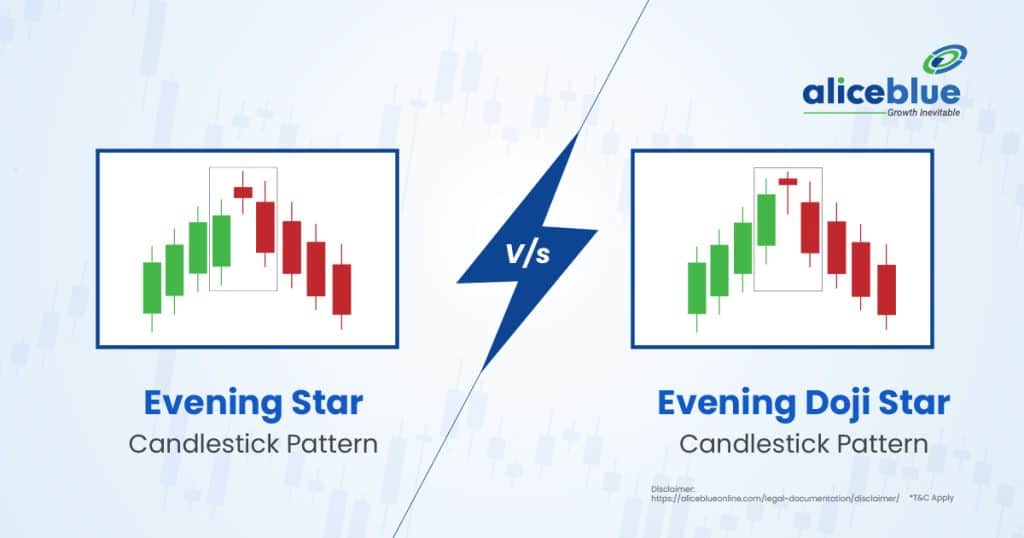
The Evening Doji Star and Evening Star are bearish reversal candlestick patterns appearing at the end of an uptrend. The key difference is that the Evening Doji Star has a Doji candle, indicating indecision, while the Evening Star has a small-bodied candle.
Content:
- Evening Doji Star Meaning
- Evening Star Meaning
- Difference Between Evening Doji Star and Evening Star Candlestick Pattern
- Characteristics of Evening Doji Star
- Characteristics of Evening Star
- How to Identify an Evening Doji Star Pattern?
- How to Identify an Evening Star Candlestick Pattern?
- Trading Strategies for Evening Doji Star
- Trading Strategies for Evening Star
- Difference Between Evening Doji Star and Evening Star – Quick Summary
- Evening Doji Star vs Evening Star Candlestick Pattern – FAQs
Evening Doji Star Meaning
Evening Doji Star is a bearish reversal candlestick pattern that appears at the top of an uptrend. It consists of a strong bullish candle, followed by a Doji that signals market indecision and a final bearish candle confirming the trend reversal.
The pattern suggests weakening buying pressure, with sellers gaining control. The Doji reflects uncertainty and the third candle confirms the shift in momentum. Traders use this pattern to anticipate potential downtrends and apply risk management strategies accordingly.

Evening Star Meaning
Evening Star is a bearish reversal candlestick pattern that appears after an uptrend. It consists of a strong bullish candle, a small-bodied candle indicating indecision and a final bearish candle that closes below the first candle’s midpoint, confirming the trend reversal.
This pattern signals weakening buying pressure and a potential downtrend. The small-bodied second candle reflects market hesitation, while the third bearish candle confirms seller dominance. Traders use this pattern to identify selling opportunities and implement stop-loss strategies to manage risk.
Difference Between Evening Doji Star and Evening Star Candlestick Pattern
The main difference between the Evening Doji Star and the Evening Star candlestick pattern lies in the second candle. The Evening Doji Star has a Doji, indicating strong market indecision before reversal, whereas the Evening Star has a small-bodied candle, showing a gradual shift from bullish to bearish sentiment.
| Aspect | Evening Doji Star | Evening Star |
| Second Candle | The second candle is a Doji, indicating strong market indecision. This Doji suggests neither buyers nor sellers have control before the final bearish confirmation. | The second candle is small-bodied, representing mild hesitation in the ongoing uptrend before sellers push prices lower with the third bearish candle. |
| Reversal Strength | More reliable because the Doji highlights extreme uncertainty before sellers take over, making it a stronger reversal signal. | Slightly less reliable as the second candle has a small body instead of a Doji, meaning the transition from bullish to bearish is more gradual. |
| Market Sentiment | Suggests a sudden shift in sentiment as buyers lose momentum and sellers take control sharply after the Doji. | Reflects a gradual loss of bullish strength, with sellers gaining control more steadily rather than an abrupt reversal. |
| Confirmation | Requires the third candle to be a strong bearish close below the first candle’s midpoint for proper confirmation. | Confirmation is achieved when the third bearish candle closes below the midpoint of the first candle, signalling a valid bearish reversal. |
Characteristics of Evening Doji Star
The main characteristic of the Evening Doji Star pattern is its strong reversal signal at the top of an uptrend. It consists of a large bullish candle, followed by a Doji indicating indecision and then a strong bearish candle confirming the trend reversal.
- Formation Structure: The pattern consists of three candles: a strong bullish candle, a Doji showing market indecision and a bearish candle that confirms the reversal. The Doji suggests that buying pressure is weakening, leading to a potential downtrend.
- Indecision in Market: The second candle, which is a Doji, reflects uncertainty as neither buyers nor sellers dominate. This lack of control signals a pause before a potential trend reversal occurs with the third bearish candle.
- Stronger Reversal Signal: Since Doji emphasizes market indecision, the Evening Doji Star is considered a more powerful bearish reversal signal than the standard Evening Star, especially when confirmed by strong selling pressure in the third candle.
- Confirmation Requirement: The pattern is only validated when the third candle closes below the midpoint of the first bullish candle. Additional confirmation through high trading volume or other indicators, such as RSI divergence, strengthens the signal.
Characteristics of Evening Star
The main characteristic of the Evening Star pattern is its strong bearish reversal signal at the peak of an uptrend. It consists of a large bullish candle, a small-bodied candle indicating hesitation and a strong bearish candle confirming the trend reversal.
- Three-Candle Formation: The pattern includes a large bullish candle, a small-bodied candle (which can be bullish or bearish) and a strong bearish candle. The middle candle signifies market hesitation, hinting at a weakening uptrend.
- Trend Reversal Signal: The pattern suggests that buying pressure is fading and sellers are taking control. The final bearish candle must close below the midpoint of the first candle to confirm the reversal.
- Market Psychology: The first bullish candle shows strong buying momentum, but the second small-bodied candle reflects indecision. The third bearish candle confirms that sellers have gained control, leading to a potential downtrend.
- Confirmation Factors: Traders look for additional confirmation through volume analysis, bearish indicators like RSI divergence, or moving average crossovers. A high-volume bearish candle in the third position strengthens the pattern’s reliability.
How to Identify an Evening Doji Star Pattern?
To identify an Evening Doji Star pattern, look for a strong bullish candle followed by a Doji, which signals market indecision. The Doji should gap above the first candle, showing hesitation. A strong bearish candle closing below the first candle’s midpoint confirms the reversal.
This pattern appears at the top of an uptrend, indicating a potential bearish reversal. The Doji suggests that buying pressure is weakening and sellers are preparing to take control. Traders should validate the pattern with volume analysis and other technical indicators before making trading decisions.

How to Identify an Evening Star Candlestick Pattern?
To identify an Evening Star candlestick pattern, observe a strong bullish candle followed by a smaller-bodied candle, which can be bullish or bearish, signaling hesitation. The third candle must be a strong bearish candle, closing below the midpoint of the first candle.
This pattern forms at the peak of an uptrend, indicating a potential bearish reversal. The second candle’s small body represents market uncertainty and the third bearish candle confirms selling pressure. Traders should verify the pattern using volume analysis and technical indicators before making trading decisions.

Trading Strategies for Evening Doji Star
The main trading strategy for the Evening Doji Star pattern involves confirming the reversal with volume analysis, entering after the bearish confirmation candle, setting a stop-loss above the Doji’s high and defining profit targets using key support levels, moving averages, or trailing stops for risk management.
- Confirmation Before Entry: Wait for the bearish candle after the Doji to close below the first bullish candle’s midpoint, confirming the downtrend before entering the trade.
- Stop-Loss Placement: Place a stop-loss slightly above the Doji’s high to limit potential losses in case the price action reverses unexpectedly.
- Profit Targets: Identify key support levels or previous lows to set exit targets, ensuring a structured risk-reward ratio for optimized trading results.
- Volume Analysis: Validate the pattern with increasing bearish volume on the confirmation candle, reinforcing the pattern’s reliability and strengthening the bearish reversal signal
Trading Strategies for Evening Star
The main trading strategy for the Evening Star pattern involves confirming the bearish reversal with additional indicators, entering after a strong confirmation candle, placing stop-losses strategically and setting profit targets based on key support levels to optimize risk management and maximize gains.
- Validate Trend Reversal: Ensure the downtrend is confirmed by the third candle closing below the first bullish candle’s midpoint. This step prevents premature entries and increases confidence in the pattern’s bearish signal before initiating a short trade.
- Risk Management Approach: Place a stop-loss just above the highest point of the Evening Star formation. This protects against unexpected price movements while giving enough flexibility for natural market fluctuations without being stopped out too early.
- Profit Target Strategy: Use Fibonacci levels, previous support zones, or moving averages to determine profit targets. Exiting trades at these levels helps optimize gains and prevent holding onto positions for too long, reducing potential losses from trend reversals.
- Volume and Indicator Confirmation: Confirm the pattern’s strength using indicators like RSI, Bollinger Bands, or MACD. If volume decreases on the middle candle and spikes on the third, it strengthens the bearish outlook, increasing trade reliability.
Difference Between Evening Doji Star and Evening Star – Quick Summary
- The Evening Doji Star pattern signals a bearish reversal after an uptrend. It consists of a strong bullish candle, a Doji reflecting market indecision and a bearish candle confirming the reversal, indicating a potential downtrend continuation.
- The Evening Star pattern is a three-candle bearish reversal formation appearing at the top of an uptrend. It includes a bullish candle, a small-bodied candle and a strong bearish candle, signalling a potential shift to a downtrend.
- The main difference is that the Evening Doji Star contains a Doji, emphasizing stronger market indecision, while the Evening Star has a small-bodied candle that still shows hesitation but is less uncertain than the Doji version.
- The Evening Doji Star consists of a bullish candle, a Doji and a bearish candle; it appears at uptrend peaks, signifies indecision before a reversal and requires confirmation through the third candle’s strong bearish close to validate the trend shift.
- The Evening Star includes a large bullish candle, a small-bodied candle indicating hesitation and a strong bearish candle confirming the trend reversal. It appears at resistance levels and suggests a weakening bullish momentum leading to a potential downtrend.
- The Evening Doji Star pattern appears at the end of an uptrend, with a Doji forming after a bullish candle, followed by a bearish candle closing below the first candle’s midpoint, confirming the reversal.
- The Evening Star pattern forms after an uptrend, starting with a strong bullish candle, a small-bodied candle indicating hesitation and a bearish candle closing below the midpoint of the first candle, confirming the trend reversal.
- Traders confirm the Evening Doji Star pattern with volume and indicators, enter after the bearish confirmation candle, set a stop-loss above the Doji’s high and establish profit targets based on support zones or Fibonacci levels for effective risk management.
- Traders validate the Evening Star pattern using RSI or MACD, enter short after the third candle confirms the reversal, place a stop-loss above the small-bodied candle and define profit targets using key support levels or trailing stop mechanisms.
- Open a free demat account with Alice Blue in 15 minutes today! Invest in Stocks, Mutual Funds, Bonds & IPOs for Free. Also, trade at just ₹ 20/order brokerage on every order.

Evening Doji Star vs Evening Star Candlestick Pattern – FAQs
1. What Is The Difference Between Evening Doji Star and Evening Star?
The main difference between the Evening Doji Star and Evening Star patterns is the second candle. The Evening Doji Star has a Doji, indicating market indecision, while the Evening Star has a small-bodied candle reflecting a gradual shift in momentum.
2. What Is An Evening Doji Star Pattern?
The Evening Doji Star is a bearish reversal pattern that forms after an uptrend. It consists of three candles: a strong bullish candle, a Doji showing hesitation and a bearish candle confirming the trend reversal and potential price decline.
3. What Is Evening Star Meaning?
The Evening Star is a bearish reversal candlestick pattern that appears at the peak of an uptrend. It includes three candles: a bullish candle, a small-bodied candle and a strong bearish candle that signals declining momentum and a potential trend reversal.
4. Is The Evening Doji Star Pattern Reliable?
The Evening Doji Star pattern is considered reliable when confirmed by high trading volume and additional technical indicators like RSI or moving averages. The stronger the bearish candle that follows, the more dependable the reversal signal for traders.
5. What Happens After An Evening Doji Star Pattern?
After an Evening Doji Star pattern forms, selling pressure often increases, leading to a downward trend. If confirmed by strong bearish momentum and high trading volume, the price typically declines further, providing short-selling or exit opportunities for traders.
6. What Happens After An Evening Star Candlestick Pattern?
Following the Evening Star pattern, a price drop is expected due to weakening buying pressure. A confirmed reversal with strong bearish momentum often leads to further declines, making it a useful signal for traders to consider short positions or risk management strategies.
7. Is Evening Star A Stronger Signal Than Evening Doji Star?
The Evening Star pattern is often considered stronger than the Evening Doji Star because the second candle is not a Doji but a small-bodied candle that gradually transitions control from buyers to sellers, making the signal clearer and more reliable.
8. What Does An Evening Doji Star Pattern Indicate?
The Evening Doji Star pattern signals a potential trend reversal from bullish to bearish. It reflects market hesitation at a peak, where buyers lose control and sellers gain dominance, leading to declining prices if confirmed by strong bearish momentum.
9. What Is The Opposite Of The Evening Star Pattern?
The opposite of the Evening Star pattern is the Morning Star. The Morning Star appears at the bottom of a downtrend and signals a potential bullish reversal, consisting of a bearish candle, a small-bodied candle and a strong bullish candle.
10. Can Evening Doji Star and Evening Star Occur In Both Bullish And Bearish Markets?
No, Evening Doji Star and Evening Star patterns typically form at the top of an uptrend, signalling a bearish reversal. They do not appear in bearish markets but indicate potential trend shifts when an uptrend loses strength.
We hope you’re clear on the topic, but there’s more to explore in stocks, commodities, mutual funds, and related areas. Here are important topics to learn about.
Disclaimer: The above article is written for educational purposes and the companies’ data mentioned in the article may change with respect to time. The securities quoted are exemplary and are not recommendatory.





