


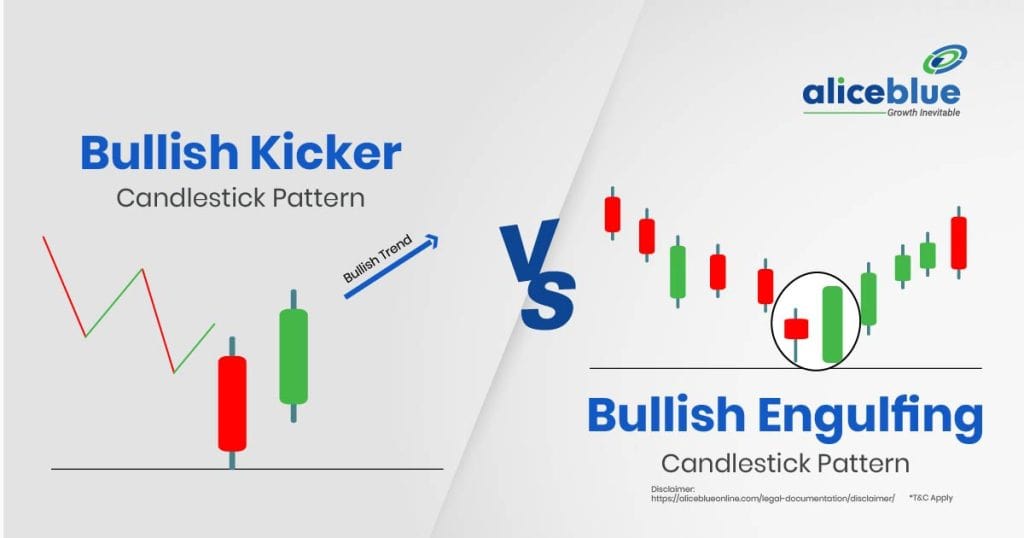
A Bullish Kicker pattern signals a strong trend reversal with a gap-up opening, completely ignoring the previous bearish candle. In contrast, a Bullish Engulfing pattern forms when a bullish candle fully engulfs the prior bearish candle, indicating potential upward momentum but without a gap-up opening.
Content:
- Bullish Kicker Meaning
- Bullish Engulfing Meaning
- Difference Between Bullish Kicker and Bullish Engulfing Candlestick Pattern
- Characteristics of Bullish Kicker
- Characteristics of Bullish Engulfing
- How to Identify a Bullish Kicker Pattern?
- How to Identify a Bullish Engulfing Candlestick Pattern?
- Trading Strategies for Bullish Kicker
- Trading Strategies for Bullish Engulfing
- Difference Between Bullish Kicker and Bullish Engulfing – Quick Summary
- Bullish Kicker vs Bullish Engulfing Candlestick Pattern – FAQs
Bullish Kicker Meaning
A Bullish Kicker candlestick pattern signals a strong reversal from a bearish to a bullish trend. It occurs when a stock opens significantly higher than the previous close, forming a gap-up and continues rising with strong momentum, ignoring the prior bearish candle, showing sudden bullish strength.
This pattern often appears after a prolonged downtrend or consolidation, indicating aggressive buying pressure. The absence of wicks at the gap zone reinforces conviction, suggesting that market sentiment has drastically shifted. Traders consider it a highly reliable bullish reversal pattern, especially when supported by strong volume, confirming institutional participation in the move.

Bullish Engulfing Meaning

A Bullish Engulfing candlestick pattern forms when a bullish candle completely engulfs the previous bearish candle’s body. This pattern indicates a potential reversal, as buyers overpower sellers, pushing the price significantly higher. It typically appears at the end of a downtrend, signalling renewed bullish sentiment in the market.
For confirmation, traders look for increased volume and a continuation candle. If followed by strong buying, it strengthens the bullish outlook. The larger the engulfing candle, the stronger the reversal signal. However, traders often use additional indicators, such as RSI or support levels, to validate the pattern before entering trades.
Difference Between Bullish Kicker and Bullish Engulfing Candlestick Pattern
The Bullish Kicker shows a sudden sentiment shift with a gap-up opening, while the Bullish Engulfing forms when a bullish candle completely engulfs the previous bearish candle, signalling a potential reversal.
| Aspect | Bullish Kicker | Bullish Engulfing |
| Definition | A pattern where a downtrend is followed by a large gap up. | A small bearish candle followed by a large bullish candle. |
| Market Sentiment | Indicates a strong change in sentiment without overlap in prices. | Shows a shift from bearish to bullish sentiment in two days. |
| Candlestick Formation | Consists of two candles: a bearish followed by a bullish gap. | Consists of two candles where the bullish candle engulfs the bearish. |
| Occurrence | Less common, indicative of a sudden market shift. | More common, typically at the end of downtrends. |
| Predictive Value | High predictive value for a swift change in direction. | A good predictor of a potential reversal or continuation. |
Characteristics of Bullish Kicker
A Bullish Kicker pattern signals a strong trend reversal, often triggered by unexpected news, causing a sharp price gap and bullish momentum.
- Appears after a downtrend, indicating a sudden bullish sentiment shift with a gap-up opening.
- The first candle is bearish, followed by a large bullish candle with no overlap.
- Volume significantly increases on the second candle, confirming strong buying pressure.
- Often forms due to unexpected fundamental changes, creating a sharp price movement.
Characteristics of Bullish Engulfing
A Bullish Engulfing pattern forms at the end of a downtrend, where a bullish candle engulfs the previous bearish candle, signalling a reversal.
- The second candle is larger and completely engulfs the previous bearish candle’s body.
- Indicates a transition from bearish control to strong bullish momentum.
- Typically appears at support levels, confirming potential price reversals.
- Stronger when accompanied by high trading volume on the second candle.
How to Identify a Bullish Kicker Pattern?
A Bullish Kicker pattern is identified by a sudden gap-up after a bearish trend, signalling an immediate bullish reversal.
- The first candle is bearish, followed by a bullish candle opening with a gap-up.
- No overlap between the two candles, confirming a sharp sentiment shift.
- The high trading volume on the second candle strengthens the pattern’s reliability.
- Often occurs due to unexpected news or major market events.
How to Identify a Bullish Engulfing Candlestick Pattern?
A Bullish Engulfing pattern is recognized when a strong bullish candle engulfs the previous bearish candle’s body, signalling a reversal.
- The first candle is bearish, showing weakness in price movement.
- The second candle opens lower but closes significantly higher, engulfing the previous candle.
- Occurs after a downtrend, confirming a potential bullish reversal.
- Stronger when accompanied by high volume, indicating increased buying interest.
Trading Strategies for Bullish Kicker
The Bullish Kicker pattern signals a sharp trend reversal with strong momentum. Traders use it to capitalize on sudden shifts in sentiment, often driven by fundamental changes. It’s essential to confirm the pattern with volume and trade strategically for maximum gains.
- Enter After Confirmation: Wait for a strong bullish candle close with high volume. This ensures the momentum is genuine, reducing the risk of false breakouts before entering the trade.
- Use Stop-Loss Wisely: Place stop-loss below the gap-up candle’s opening price. This protects against sudden reversals and minimizes potential losses if the pattern fails to sustain.
- Ride the Momentum: Utilize trailing stop-losses to maximize profits as price surges. Since bullish kickers indicate strong moves, holding positions with adjustments ensures optimal returns.
- Avoid Low-Volume Setups: If the pattern forms with weak volume, the move may lack conviction. Always validate with volume and supporting indicators like RSI or MACD.
Trading Strategies for Bullish Engulfing
A Bullish Engulfing pattern suggests a reversal after a downtrend, making it a strong entry signal. Traders rely on confirmation signals and volume analysis to maximize profitability while managing risk effectively in trending markets.
- Confirm Trend Reversal: Look for the pattern near support zones or after prolonged downtrends. A bullish engulfing candle at these levels increases the probability of a successful upward move.
- Check Volume Strength: Higher volume on the engulfing candle confirms strong buying pressure. Weak volume may indicate an uncertain reversal, requiring additional confirmations like moving averages or trendlines.
- Set Logical Stop-Loss: Place stop-loss below the engulfing candle’s low to manage risk. This ensures protection against failed reversals while allowing enough room for natural price movements.
- Combine with Indicators: Use RSI, MACD, or moving averages to enhance accuracy. A bullish engulfing pattern with additional technical confirmations increases confidence in the trade’s potential success.
Difference Between Bullish Kicker and Bullish Engulfing – Quick Summary
- A Bullish Kicker is a strong reversal pattern where a bullish candle gaps up after a bearish candle, signaling an immediate trend shift due to significant market sentiment change.
- A Bullish Engulfing is a candlestick pattern where a large bullish candle completely engulfs the previous bearish candle, indicating a potential trend reversal and increasing buying momentum.
- A Bullish Kicker forms with a gap-up, showing an immediate sentiment shift, while a Bullish Engulfing gradually forms, with a bullish candle overtaking the previous bearish candle.
- A Bullish Kicker has no overlap between two candles, appears with high volume, forms due to sudden market changes and indicates a strong bullish move.
- A Bullish Engulfing consists of a small bearish candle followed by a larger bullish candle, signals a potential reversal and forms at support levels with high trading volume.
- Open a free demat account with Alice Blue in 15 minutes today! Invest in Stocks, Mutual Funds, Bonds & IPOs for Free. Also, trade at just ₹ 20/order brokerage on every order.

Bullish Kicker vs Bullish Engulfing Candlestick Pattern – FAQs
1. What Is The Difference Between Bullish Kicker and Bullish Engulfing?
A Bullish Kicker forms with a gap-up, indicating an immediate sentiment shift, while a Bullish Engulfing develops gradually as a bullish candle fully engulfs the prior bearish candle, signalling a potential trend reversal.
2. What Is A Bullish Kicker Pattern?
A Bullish Kicker is a two-candle pattern where a bearish candle is followed by a gap-up bullish candle, showing a sudden shift in sentiment and strong buying pressure, often due to unexpected market events or news.
3. What is Bullish Engulfing Meaning?
A Bullish Engulfing is a reversal pattern where a large bullish candle completely engulfs the previous bearish candle, signaling a potential trend change as buyers overpower sellers, typically appearing at the end of a downtrend.
4. Is The Bullish Kicker Pattern Reliable?
Yes, the Bullish Kicker pattern is highly reliable due to its strong momentum shift. However, traders should confirm with volume and technical indicators to avoid false signals, ensuring a stronger probability of a sustained upward move.
5. What Happens After A Bullish Kicker Pattern?
After a Bullish Kicker, prices often continue rising due to strong bullish sentiment. If supported by high volume and market fundamentals, the uptrend can be sustained, leading to significant price appreciation over the short to medium term.
6. What Happens After A Bullish Engulfing Candlestick Pattern?
After a Bullish Engulfing pattern, prices typically trend upward as buying pressure increases. However, traders should confirm the reversal with volume and additional indicators to ensure the pattern’s strength before making trade decisions.
7. Is Bullish Engulfing A Stronger Signal Than Bullish Kicker?
No, the Bullish Kicker is generally stronger because of its sudden price shift, whereas Bullish Engulfing indicates a more gradual reversal. However, both patterns are effective when confirmed with volume and technical indicators.
8. What Does A Bullish Kicker Pattern Indicate?
A Bullish Kicker pattern indicates a sharp change in market sentiment, signalling aggressive buying pressure. It often appears after major news or earnings reports, leading to a strong, sustained bullish trend.
9. What Is The Opposite Of The Bullish Engulfing Pattern?
The opposite of a Bullish Engulfing pattern is a Bearish Engulfing pattern, where a large bearish candle engulfs the previous bullish candle, signalling a potential bearish reversal in the market.
10. What Does A Bullish Engulfing Pattern Indicate?
A Bullish Engulfing pattern indicates a shift from bearish to bullish momentum, suggesting a potential uptrend. It shows that buyers have taken control, leading to increased demand and a possible price rally.
We hope you’re clear on the topic, but there’s more to explore in stocks, commodities, mutual funds, and related areas. Here are important topics to learn about.
Disclaimer: The above article is written for educational purposes and the companies’ data mentioned in the article may change with respect to time The securities quoted are exemplary and are not recommendatory.





