


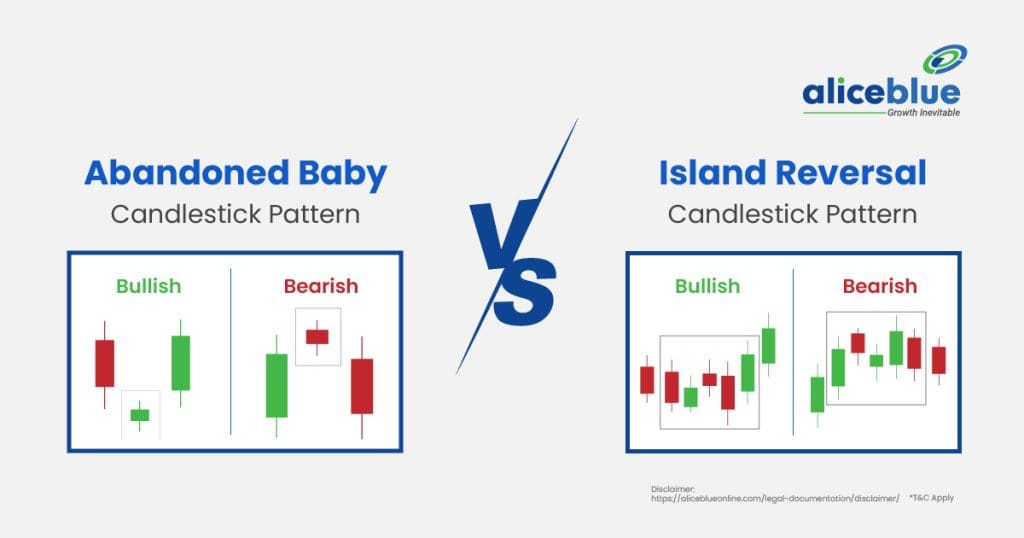
The Abandoned Baby and Island Reversal are key candlestick patterns signalling trend reversals. The Abandoned Baby features a Doji with gaps on both sides, while the Island Reversal forms a cluster of candles separated by gaps, indicating a strong market sentiment shift.
Content:
- Abandoned Baby Meaning
- Island Reversal Meaning
- Difference Between Abandoned Baby and Island Reversal Candlestick Pattern
- Characteristics of Abandoned Baby
- Characteristics of Island Reversal
- How to Identify an Abandoned Baby Pattern?
- How to Identify an Island Reversal Candlestick Pattern?
- Trading Strategies for Abandoned Baby
- Trading Strategies for Island Reversal
- Difference Between Abandoned Baby and Island Reversal – Quick Summary
- Abandoned Baby vs Island Reversal Candlestick Pattern – FAQs
Abandoned Baby Meaning
An Abandoned Baby is a three-candlestick reversal pattern that appears after a strong trend. It consists of a gap, a Doji with no overlap and another gap in the opposite direction, signaling a potential trend reversal due to weakening momentum and market indecision.
This pattern indicates that the prevailing trend has lost strength, leading to a sharp reversal. A bullish Abandoned Baby forms after a downtrend, suggesting an upward move, while a bearish Abandoned Baby appears after an uptrend, signalling a potential price decline.

Island Reversal Meaning
Island Reversal is a candlestick pattern that signals a strong trend reversal. It forms when a group of candles is isolated by gaps on both sides, creating an “island.” This pattern indicates a sudden shift in market sentiment, trapping traders on the wrong side.
A bullish Island Reversal occurs after a downtrend, suggesting a strong upward move, while a bearish Island Reversal forms after an uptrend, signalling a potential decline. The pattern’s reliability increases when confirmed with high volume and follow-through price action.
Difference Between Abandoned Baby and Island Reversal Candlestick Pattern
The main difference between the Abandoned Baby and Island Reversal patterns is their structure. The Abandoned Baby features a single Doji with gaps on both sides, while the Island Reversal consists of multiple candles isolated by gaps. Both indicate reversals, but Island Reversal traps more traders.
| Point | Abandoned Baby | Island Reversal |
| Structure | A three-candle pattern with a gap, a Doji and another gap in the opposite direction, signalling a reversal. | A group of candles isolated by gaps on both sides forms a price cluster that signals a major trend reversal. |
| Reversal Strength | Provides a strong reversal signal, but requires confirmation with volume and follow-through price action. | Considered more reliable as multiple candles confirm the trend shift, reducing false signals. |
| Occurrence | Less frequent due to strict formation rules, making it a rare but powerful pattern when identified. | More common as it allows multiple candles to form within the isolated price range. |
| Trader Impact | This creates moderate confusion, prompting traders to wait for confirmation before making decisions. | Traps many traders in losing positions as the price gaps make it difficult to exit smoothly. |
Characteristics of Abandoned Baby
The main characteristic of the Abandoned Baby pattern is its distinct three-candle formation, where a Doji appears between two gap candles in opposite directions. This structure signals a strong reversal in market sentiment, often leading to a sharp trend change. It is a rare but highly reliable candlestick pattern.
- Three-Candle Formation: The pattern consists of three candles—a gap in the trend direction, a Doji with no overlap and a gap in the opposite direction. The middle Doji highlights market indecision and the second gap confirms a reversal, making this a powerful bullish or bearish signal.
- Gaps on Both Sides: The defining feature of this pattern is the presence of two gaps, ensuring that the Doji remains isolated. These gaps indicate a sudden shift in market sentiment and the lack of overlap strengthens the reliability of the trend reversal signal.
- Rare but Strong Reversal Signal: The Abandoned Baby pattern does not appear frequently due to its strict formation requirements. However, when it forms, it is considered a strong signal of market reversal, especially when confirmed with increased trading volume and follow-through price movement.
- Requires Confirmation: While the pattern itself suggests a reversal, traders often wait for confirmation before acting. This confirmation can come from a strong follow-up candle closing in the direction of the reversal, supported by rising volume to validate the new trend direction.
Characteristics of Island Reversal
The main characteristic of the Island Reversal pattern is a cluster of candles isolated by gaps on both sides, indicating a sharp market reversal. This pattern signals a significant shift in sentiment, trapping traders on the wrong side and leading to strong price movements in the opposite direction.
- Isolated Price Cluster: The pattern consists of multiple candles forming a temporary trading range, separated from the rest of the chart by gaps. This isolation highlights a sudden shift in market dynamics, creating a strong reversal signal when prices break out in the opposite direction.
- Occurs in Both Uptrends and Downtrends: The Island Reversal can form at the top of an uptrend (bearish reversal) or the bottom of a downtrend (bullish reversal). In both cases, the gaps surrounding the price cluster signal an abrupt sentiment change, often triggered by news or high volatility.
- Traps Market Participants: Traders who entered positions within the island cluster find themselves stuck as the price gaps are away, leaving limited exit opportunities. This phenomenon forces traders to cut losses or adjust strategies, reinforcing the strength of the new trend direction.
- Confirmed by Volume and Follow-Through: A valid Island Reversal pattern typically shows an increase in volume at the breakout point, confirming the strength of the reversal. A strong follow-up move in the new trend direction adds further credibility, making it a high-probability trading signal.
How to Identify an Abandoned Baby Pattern?
To identify an Abandoned Baby pattern, look for a three-candle formation. The first candle follows the prevailing trend, then a Doji appears with a gap on both sides, indicating market indecision. The third candle gaps in the opposite direction, confirming a strong reversal.
This pattern is valid only if the middle Doji remains completely unconnected to the surrounding candles. Volume confirmation enhances reliability, as increased trading activity on the third candle signals strong momentum. Traders should wait for follow-through price action to confirm the trend reversal before entering a trade.

How to Identify an Island Reversal Candlestick Pattern?
To identify an Island Reversal pattern, look for a price cluster isolated by gaps on both sides. This pattern appears after a strong trend, where the price gaps, consolidates in a range and then gaps in the opposite direction, signaling a sharp reversal.
The key confirmation is the second gap, which must occur in the opposite direction of the first. Volume spikes during the breakout enhance reliability, indicating strong participation. Traders should wait for a sustained move in the new direction before making trade decisions.

Trading Strategies for Abandoned Baby
The main strategy for trading the Abandoned Baby pattern involves confirming the reversal before entering a position. Traders should look for volume spikes, wait for follow-through price action and set stop-loss levels based on support or resistance to manage risk effectively.
- Wait for Confirmation: Before entering a trade, ensure that the third candle confirms the reversal with strong momentum. Increased volume on the reversal candle strengthens reliability and traders should enter only when the price continues moving in the new trend direction.
- Use Stop-Loss Strategically: Place a stop-loss below the Doji’s low in a bullish reversal or above the Doji’s high in a bearish reversal. This helps minimize losses in case the pattern fails and the market resumes its previous trend unexpectedly.
- Set Profit Targets Wisely: Identify key resistance (for bullish reversals) or support (for bearish reversals) levels as profit targets. Traders can also use trailing stop-losses to capture extended moves while securing profits as the price progresses in the expected direction.
- Combine with Other Indicators: Enhance accuracy by using RSI, MACD, or moving averages for additional confirmation. If these indicators align with the Abandoned Baby signal, the probability of a successful trade increases, providing a stronger foundation for executing profitable trades.
Trading Strategies for Island Reversal
The main strategy for trading the Island Reversal pattern involves identifying the isolated price cluster and confirming the second gap with volume. Traders should wait for follow-through momentum, use stop-loss effectively and set profit targets based on trend strength and key support or resistance levels.
- Confirm the Reversal Gap: The second gap in the opposite direction confirms the pattern. Traders should wait for a strong candle closing beyond the island’s range. Increased volume at the breakout strengthens the signal, ensuring that the reversal is backed by strong market participation.
- Define Stop-Loss Levels: Place a stop-loss below the low of the island cluster for bullish reversals or above the high for bearish reversals. This protects against false breakouts and limits risk in case the price unexpectedly reverts to its previous trend.
- Plan Profit-Taking Zones: Identify resistance (for bullish reversals) or support (for bearish reversals) levels to exit trades. Trailing stop-losses can help capture larger price movements by locking in gains while allowing the trend to develop further, maximizing profit potential.
- Use Technical Indicators for Confirmation: Combining the Island Reversal pattern with RSI, MACD, or moving averages improves accuracy. If indicators signal overbought or oversold conditions aligning with the reversal, it strengthens the conviction for entering a trade with higher confidence.
Difference Between Abandoned Baby and Island Reversal – Quick Summary
- The Abandoned Baby pattern is a rare candlestick reversal formation that signals a strong trend shift. It consists of a gap, a Doji and another gap in the opposite direction, confirming a bullish or bearish reversal.
- The Island Reversal pattern forms when price gaps, consolidate in a tight range and then gaps in the opposite direction. This isolates the price action, signalling a potential trend reversal with increased volume confirmation.
- The main difference between Abandoned Baby and Island Reversal Candlestick Pattern is in formation and confirmation. The Abandoned Baby features a Doji between two gaps, emphasizing indecision, while the Island Reversal has multiple candles forming an isolated range before a reversal gap confirms trend change.
- Abandoned Baby has three key components: an initial gap, a Doji indicating indecision and a second gap confirming reversal. It occurs in both bullish and bearish trends and requires high volume for strong validation.
- Island Reversal consists of a price gap, consolidation in a small range and a second gap in the opposite direction. It signals sharp reversals, often accompanied by strong volume and suggests a significant shift in market sentiment.
- To identify an Abandoned Baby Pattern, look for a significant gap, a Doji indicating indecision and a second gap in the opposite direction. The pattern is validated with strong follow-through momentum and increasing volume after the confirmation candle.
- To identify an Island Reversal Candlestick Pattern, identify a price gap, observe sideways consolidation forming an “island,” then confirm the reversal with another gap in the opposite direction. A volume spike during the breakout increases the pattern’s reliability and trading confidence.
- The Abandoned Baby pattern requires confirmation through volume before entry. Traders should enter after a strong follow-through candle, set a stop-loss beyond the Doji’s high or low and define profit targets based on key support, resistance, or trailing stops.
- The Island Reversal pattern is best traded after confirming the second gap. Traders should place stop-loss levels below the island’s range, set profit targets near key resistance or support and use RSI or MACD indicators for additional confirmation before entering a position.
- Open a free demat account with Alice Blue in 15 minutes today! Invest in Stocks, Mutual Funds, Bonds & IPOs for Free. Also, trade at just ₹ 20/order brokerage on every order.

Abandoned Baby vs Island Reversal Candlestick Pattern – FAQs
1. What Is The Difference Between Abandoned Baby and Island Reversal?
The Abandoned Baby is a three-candle reversal pattern with a gap on both sides of a Doji, signalling strong trend reversal. The Island Reversal involves a price gap before and after a cluster of candles, indicating a shift in market sentiment.
2. What Is An Abandoned Baby Pattern?
An Abandoned Baby is a candlestick reversal pattern forming after a strong trend. It consists of a gap, a Doji with no overlap and another gap in the opposite direction, signaling a significant reversal due to weakening momentum and potential trend change.
4. What Is Island Reversal Meaning?
Island Reversal is a candlestick pattern where a group of candles is separated by gaps on both sides. This formation indicates a strong reversal as it reflects a sudden shift in market sentiment, trapping traders on the wrong side of the trend.
5. Is The Abandoned Baby Pattern Reliable?
The Abandoned Baby pattern is considered highly reliable due to its distinct gap formation and Doji candle. When confirmed with high volume and strong follow-through price action, it provides a strong reversal signal, helping traders make informed decisions on trend shifts.
6. What Happens After An Abandoned Baby Pattern?
After an Abandoned Baby pattern, the previous trend weakens and a strong reversal occurs. If it forms after a downtrend, a bullish rally may follow, while in an uptrend, a bearish drop is likely. Confirmation through subsequent candles is crucial for accuracy.
7. What Happens After An Island Reversal Candlestick Pattern?
After an Island Reversal pattern, the price moves sharply in the opposite direction due to trapped traders reacting to the sudden sentiment change. This pattern often leads to sustained reversals, with the market attempting to regain equilibrium after a sudden breakout or breakdown.
8. Is Island Reversal A Stronger Signal Than Abandoned Baby?
The Island Reversal can be stronger than the Abandoned Baby since it consists of multiple candles, confirming a more established shift in sentiment. However, both patterns are highly effective and their reliability depends on volume, market conditions and subsequent confirmation.
9. What Does An Abandoned Baby Pattern Indicate?
An Abandoned Baby pattern indicates a sharp reversal in market sentiment. It signals that buyers or sellers have lost control, leading to a potential trend shift. The distinct gap formation makes it a strong indicator of an impending bullish or bearish move.
10. What Is The Opposite Of The Island Reversal Pattern?
The opposite of the Island Reversal pattern is another Island Reversal in the opposite direction. A bullish Island Reversal follows a downtrend and leads to a rally, while a bearish Island Reversal appears after an uptrend and signals a downward move.
11. Can Abandoned Baby and Island Reversal Occur In Both Uptrends And Downtrends?
Yes, both patterns can appear in uptrends and downtrends. A bullish Abandoned Baby or Island Reversal occurs after a downtrend, signalling a reversal to the upside, while a bearish version forms after an uptrend, indicating a potential market decline.
We hope you’re clear on the topic, but there’s more to explore in stocks, commodities, mutual funds, and related areas. Here are important topics to learn about.
Disclaimer: The above article is written for educational purposes and the companies’ data mentioned in the article may change with respect to time. The securities quoted are exemplary and are not recommendatory.





