
Ever wondered what those jargons that professional traders you see across social media keep talking about? What do those chart screenshots mean?
Ever wish you understood what those meant and how to read a chart and identify future patterns on your own?
Understanding and reading a chart, and trying to make use of it, is what is simply called Technical Analysis. Support and resistance are the foundations of understanding and learning technical analysis.
So, let’s start by exploring what technical analysis generally means.
Technical Analysis simply means the study of past price movements and patterns on a chart to help predict future price trends. Traders use charts, trends, and other indicators, often using a tool called TradingView, through which they make decisions about when to sell or buy or if it’s better to hold.
Throughout this article, we will be using Charts from TradingView to explain different terminologies.
Let’s look at what support and resistance mean by using an analogy like a floor and a ceiling, where the floor represents support and the ceiling represents resistance.
Support: Think of the price of an asset like a ball bouncing inside a room. The floor acts as a support, stopping the ball from falling further down.
Resistance: The ceiling acts as a resistance, preventing the ball from rising further.
Support: The support level is a price point on the chart where traders expect strong demand (where buying is strong) for the stock/index. Whenever the price falls to the support line, it is likely to bounce in the opposite direction. The support level is always below the current market price.
Resistance: The resistance level is a price point on the chart where traders expect strong supply (where selling is strong) for the stock/index. Whenever the price rises to the resistance line, it is likely to bounce in the opposite direction. The resistance level is always above the current market price.
Let’s take the example of an Unnamed Stock’s Price.
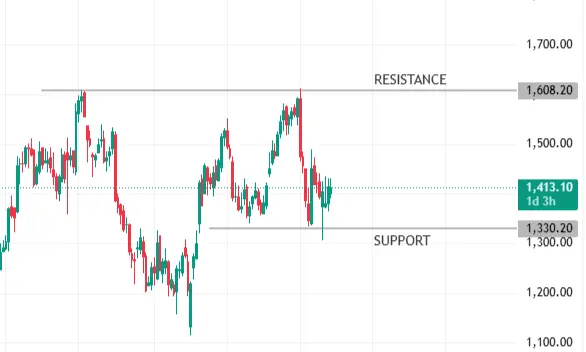
Support: Whenever the price falls to the ₹1,300 range, the buyers are strong, indicating a strong demand.
Resistance: Whenever the price rises to the ₹1,600 range, the sellers are strong, indicating a strong supply.
Helps in Entry/Exit Positions and Risk Management: It helps traders to have control of their portfolio valuation, helping them decide when to sell during crashes, minimizing losses, and better risk management, as well as when to buy, to maximize profits and be an early buyer if a stock price is undervalued.
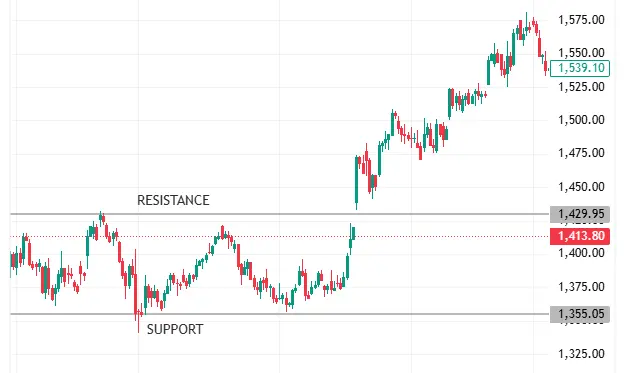
Identifying Trends: Falling below a previous support is considered a market downtrend, where fear dominates, while rising above a previous resistance is considered a market uptrend, where greed dominates.
Experienced traders use indicators like 50 EMA, 200 EMA, to name a few, where EMA stands for Exponential Moving Average, and is a technical indicator that calculates the average price over a specific period, used to identify trends faster.
Many traders place limit buy orders at known support levels, which get executed the moment the price touches, bringing huge volume from investors, naturally pushing the price back up.
Yes, this is called ‘Role Reversal. Once the support level is broken, then it becomes the new resistance. Traders who didn’t sell during the crash often try to break even when the price returns to that level, creating new selling pressure.
Yes, you can find these patterns on a 5-minute chart or a monthly chart. However, higher timeframe levels like daily or weekly charts are generally considered much stronger and more reliable.
A fakeout (false breakout) happens when the price briefly moves above resistance or below support, tricking traders into entering a position, only to reverse sharply and go back to the previous range. This is why most professional traders often wait for a retest before entering.
A legitimate breakout is usually accompanied by a significant spike in volume. If price breaks out on low volume, it’s more likely a trap (often called a bullish/bearish trap)
200 EMA is widely considered the gold standard for long-term investors. When a stock stays above its 200 EMA, it’s generally viewed as being in a long-term uptrend.
Breakouts can indicate strong upward momentum, but it’s important to confirm with volume or a retest of the broken level to avoid fakeouts.
A retest happens after a breakout when the price returns to the previously broken support or resistance. If the level holds, it often becomes a strong entry or exit point.
No, support and resistance are best used alongside other technical indicators and trend analysis to reduce risks and make better trading decisions.
Not always. Highly volatile or illiquid stocks may have less defined levels, making it harder to trade purely on support and resistance.
Traders use stop-loss orders near support or resistance levels to limit losses if the price moves against them, to protect capital, and maintain disciplined trading.
Moving averages act as dynamic support/resistance, especially in trending markets, but these are best used together with horizontal or trendline levels.
Yes, support and resistance are considered a universal concept in technical analysis.
Attention Investors!
Stock Brokers can accept securities as margin from clients only by way of pledge in the depository system w.e.f. September 1, 2020. Update your mobile number & email Id with your stock broker/depository participant and receive OTP directly from the depository on your email id and/or mobile number to create a pledge. Pay 20% upfront margin of the transaction early to trade in the cash market segment. Investors may please refer to the Exchange’s Frequently Asked Questions (FAQs) issued vide circular reference NSE/INSP/45191 dated July 31, 2020, and NSE/INSP/45534 dated August 31, 2020, and other guidelines issued from time to time in this regard. Check your Securities /MF/ Bonds in the consolidated account statement issued by NSDL/CDSL every month.
Corporate Office: No. 153/2, 3rd Floor, M.R.B.Arcade, Bagalur Main Road, Dwaraka Nagar, Yelahanka, Bengaluru – 560 063, Karnataka.
Registered Office: Old No.56/2 ,New No.58, LIC Nagar, Vinayagar Kovil Street, Erode -8,Tamil Nadu– 638002.
Alice Blue Financial Services (P) Ltd : NSE EQ | NSE FO | NSE CDS-90112 SEBI REG : INZ000156038
Alice Blue Financial Services (P) Ltd : BSE EQ | BSE FO | BSE CD-6670 SEBI REG : INZ000156038
Alice Blue Financial Services (P) Ltd : CDSL DP ID 12085300 DP SEBI REG : IN-DP-364-2018
Alice Blue Financial Services (P) Ltd : MCX-56710 SEBI REG : INZ000156038
We hereby declare that we are doing PRO trading
Procedure to file a complaint on SEBI SCORES : Register on SEBI SCORES 2.0. Mandatory details for filing complaints on SCORES: Name, PAN, Address, Mobile Number, E-mail ID. Benefits: Effective Communication, Speedy redressal of the grievances
Click on the provided link to learn about the process for submitting a complaint on the ODR platform for resolving investor grievances.
Investment in securities markets are subject to market risks, read all the related documents carefully before investing. Brokerage will not exceed SEBI prescribed limit.
For queries regarding account opening or activation, email to [email protected] and for fund updates, email to [email protected]
Disclaimer : Prevent unauthorized transactions in your account. Update your mobile numbers/email IDs with your stock brokers. Receive information of your transactions directly from Exchange on your mobile/email at the end of the day. Issued in the interest of investors. All clients have to update their email id and mobile number with Member : Investor Grievance [email protected]
KYC is a one time exercise while dealing in securities markets – once KYC is done through a SEBI registered intermediary (broker, DP, Mutual Fund etc.), you need not undergo the same process again when you approach another intermediary.
No need to issue cheques by investors while subscribing to an IPO. Just write the bank account number and sign in the application form to authorise your bank to make payment in case of allotment. No worries for refund as the money remains in the investor’s account.
Investors are requested to note that Alice Blue Financial Services Private Limited is permitted to receive money from investor through designated bank accounts only named as Up streaming Client Nodal Bank Account (USCNBA). Alice Blue Financial Services Private Limited is also required to disclose these USCNB accounts to Stock Exchange. Hence, you are requested to use following USCNB accounts only for the purpose of dealings in your trading account with us. The details of these USCNB accounts are also displayed by Stock Exchanges on their website under “Know/ Locate your Stock Broker. Bank Details (Valid UPI FAQ).


