
Fuel prices are constantly changing across the world, but why?
One major reason is fluctuations in oil supply and global demand. Factors like production cuts, natural disasters affecting oil infrastructure, or sudden shifts in consumption can reduce availability, causing prices to rise.
When supply chains are affected like this, prices react almost instantly. And that’s exactly where one of the most important economic concepts comes into play: supply and demand.
But this concept doesn’t just apply to fuel or everyday goods; it’s one of the core forces driving the stock market.
Let’s break it down from a trader’s perspective.
Supply and demand in trading refers to the relationship between the availability of a financial asset and a trader’s willingness to buy or sell it, which ultimately determines the price.
Traders use this concept to identify key price levels, predict market movements, and make better trading decisions.
Note: “Support and Resistance” and “Supply and Demand” are closely related but are not the same concept.
Supply and demand trading is a type of strategy that focuses on identifying price zones where the buying or selling pressure is usually strong.
These zones are called:
Traders wait for these zones and react accordingly, rather than guessing trades.
A strong uptrend happens when:
This typically starts from a demand zone, also called an accumulation zone, where institutions begin buying heavily.
A downtrend occurs when:
Often begins at the supply zone, also called the distribution zone, where large players start selling.
Supply and demand zones are areas on a price chart where the price has previously reversed or moved strongly.
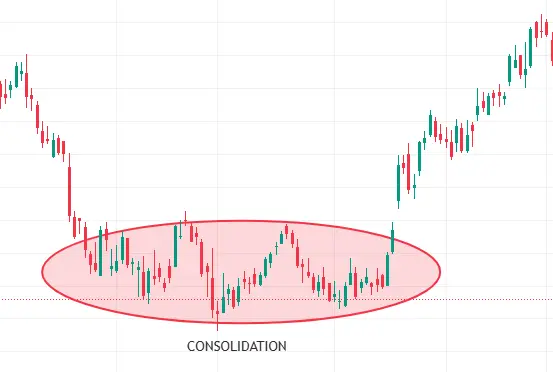
1) Down-Base-Rally:
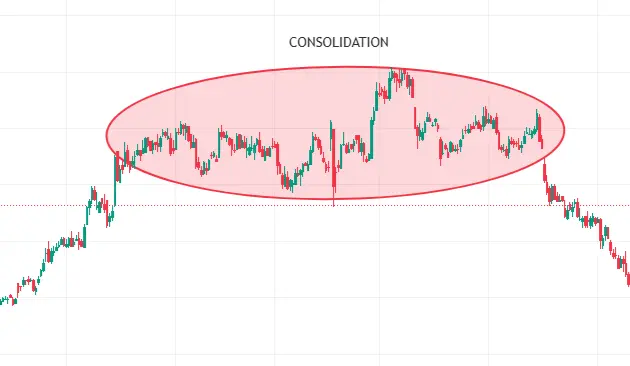
2)Rally-Base-Drop:
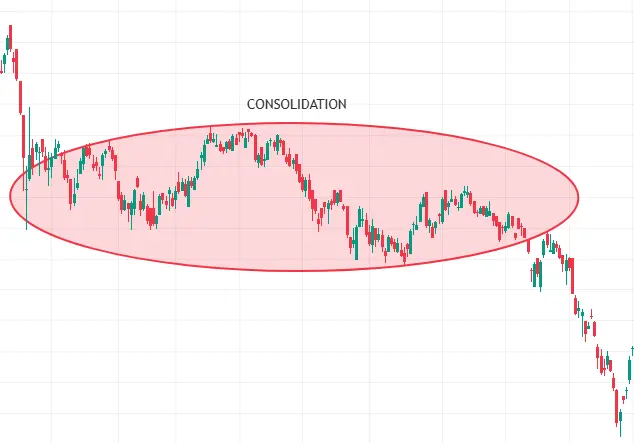
3)Drop-Base-Drop:
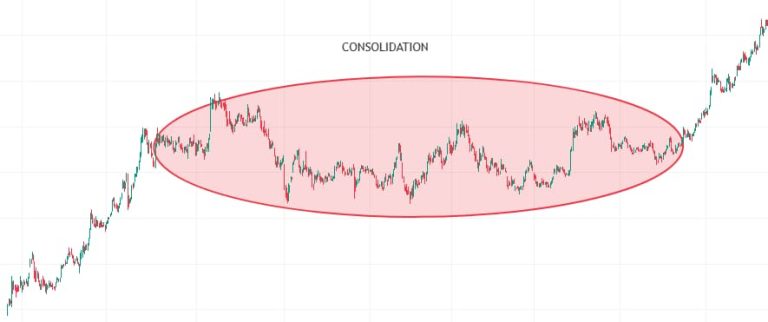
4)Rally-Base-Rally:
Supply and demand directly control price movement in trading.
These imbalances create trends, breakouts, and reversals. Understanding these helps traders anticipate market behavior instead of reacting late.
These concepts are closely related but slightly different:
|
Concept |
Meaning |
|
Demand Zone |
Area where the price tends to rise |
|
Supply Zone |
Area where the price tends to fall |
|
Support |
The level that prevents the price from falling |
|
Resistance |
The level prevents the price from rising |
1)Identify Price Reversals: Markets often reverse at supply and demand zones.
2)Improve Entry and Exit Points: Helps traders avoid random entries.
3)Understand Market Psychology: Shows where big players, such as institutions, are active.
4)Work Across Timeframes: Useful for scalping, intraday, and swing trading.
In trading, supply and demand are the foundation of all price movement. By identifying these zones, you gain a clear view of:
Always remember, success in supply and demand trading comes with practice, patience, and discipline
Beginners should look for areas where the price made a strong move after a period of consolidation. Try to focus on clear, strong moves rather than small fluctuations.
Higher timeframes like daily and 4-hour provide stronger and more reliable zoes, while lower timeframes like 15-min and 5-min are better for entry precision. Most traders combine both.
Yes, supply and demand work in all financial markets; it is based on price behavior and market psychology, which are universal.
Zones can fail due to major news events often, or strong opposing market pressure, or when the zone has been tested too many times and loses strength.
Yes, some traders use algorithms to identify zones, but human judgment is often best to interpret market context and the quality of zones.
It is beginner-friendly because it focuses on simple price actions; mastering it requires regular practice and more experience.
Attention Investors!
Stock Brokers can accept securities as margin from clients only by way of pledge in the depository system w.e.f. September 1, 2020. Update your mobile number & email Id with your stock broker/depository participant and receive OTP directly from the depository on your email id and/or mobile number to create a pledge. Pay 20% upfront margin of the transaction early to trade in the cash market segment. Investors may please refer to the Exchange’s Frequently Asked Questions (FAQs) issued vide circular reference NSE/INSP/45191 dated July 31, 2020, and NSE/INSP/45534 dated August 31, 2020, and other guidelines issued from time to time in this regard. Check your Securities /MF/ Bonds in the consolidated account statement issued by NSDL/CDSL every month.
Corporate Office: No. 153/2, 3rd Floor, M.R.B.Arcade, Bagalur Main Road, Dwaraka Nagar, Yelahanka, Bengaluru – 560 063, Karnataka.
Registered Office: Old No.56/2 ,New No.58, LIC Nagar, Vinayagar Kovil Street, Erode -8,Tamil Nadu– 638002.
Alice Blue Financial Services (P) Ltd : NSE EQ | NSE FO | NSE CDS-90112 SEBI REG : INZ000156038
Alice Blue Financial Services (P) Ltd : BSE EQ | BSE FO | BSE CD-6670 SEBI REG : INZ000156038
Alice Blue Financial Services (P) Ltd : CDSL DP ID 12085300 DP SEBI REG : IN-DP-364-2018
Alice Blue Financial Services (P) Ltd : MCX-56710 SEBI REG : INZ000156038
We hereby declare that we are doing PRO trading
Procedure to file a complaint on SEBI SCORES : Register on SEBI SCORES 2.0. Mandatory details for filing complaints on SCORES: Name, PAN, Address, Mobile Number, E-mail ID. Benefits: Effective Communication, Speedy redressal of the grievances
Click on the provided link to learn about the process for submitting a complaint on the ODR platform for resolving investor grievances.
Investment in securities markets are subject to market risks, read all the related documents carefully before investing. Brokerage will not exceed SEBI prescribed limit.
For queries regarding account opening or activation, email to [email protected] and for fund updates, email to [email protected]
Disclaimer : Prevent unauthorized transactions in your account. Update your mobile numbers/email IDs with your stock brokers. Receive information of your transactions directly from Exchange on your mobile/email at the end of the day. Issued in the interest of investors. All clients have to update their email id and mobile number with Member : Investor Grievance [email protected]
KYC is a one time exercise while dealing in securities markets – once KYC is done through a SEBI registered intermediary (broker, DP, Mutual Fund etc.), you need not undergo the same process again when you approach another intermediary.
No need to issue cheques by investors while subscribing to an IPO. Just write the bank account number and sign in the application form to authorise your bank to make payment in case of allotment. No worries for refund as the money remains in the investor’s account.
Investors are requested to note that Alice Blue Financial Services Private Limited is permitted to receive money from investor through designated bank accounts only named as Up streaming Client Nodal Bank Account (USCNBA). Alice Blue Financial Services Private Limited is also required to disclose these USCNB accounts to Stock Exchange. Hence, you are requested to use following USCNB accounts only for the purpose of dealings in your trading account with us. The details of these USCNB accounts are also displayed by Stock Exchanges on their website under “Know/ Locate your Stock Broker. Bank Details (Valid UPI FAQ).


