
Volume Profile can show where the market previously traded heavily and where it moved through with relatively little activity. But simply marking those levels does not create a trading strategy.
A practical Volume Profile strategy starts by identifying important areas such as the Point of Control (POC), Value Area High (VAH), Value Area Low (VAL), High Volume Nodes (HVNs), and Low Volume Nodes (LVNs). The trader then watches how price behaves when it reaches those areas.
The key idea is simple: Volume Profile tells you where to pay attention. Price behaviour helps you decide whether there is actually a trade.
SEBI describes technical analysis more broadly as the study of price movements, trends, patterns and trading volume. Its guide on Technical Analysis vs Fundamental Analysis provides useful background on where volume-based tools fit within technical analysis.
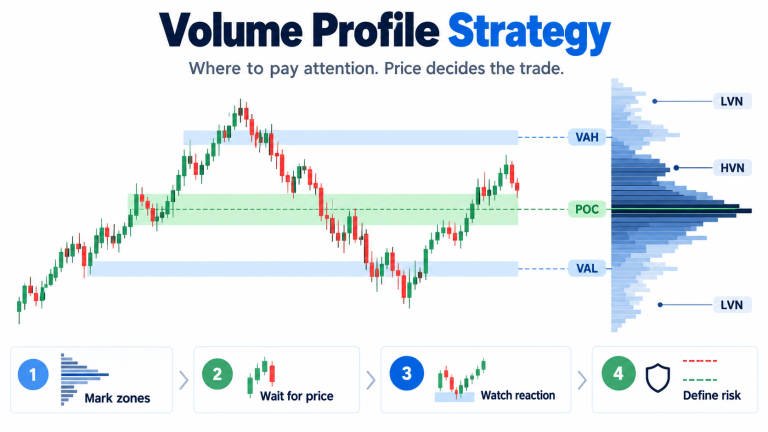
A Volume Profile strategy uses historical volume at different price levels to identify areas where the market previously showed high or low participation.
Common setups include a rejection from VAH or VAL, a breakout and retest of the Value Area, and reactions around POC, HVNs, or LVNs.
These levels should not be treated as automatic buy or sell signals. Traders generally wait for price confirmation and define their stop-loss and target before entering.
A Volume Profile strategy uses trading activity at different price levels to identify areas that may deserve closer attention.
Traditional volume shows how much is traded during each time period. Volume Profile reorganises that information by price.
The POC is the profile row with the highest recorded volume. The Value Area covers a chosen share of total profile volume, commonly around 70%, with VAH marking its upper boundary and VAL marking its lower boundary.
An HVN shows an area where relatively high trading activity occurred, while an LVN shows an area with relatively little historical activity.
These levels tell you where the market previously spent more or less trading activity. They do not tell you what price must do next.
The Point of Control marks the price row where the highest amount of volume occurred in the selected profile. Traders often monitor it because a large amount of trading previously took place there.
VAH and VAL mark the upper and lower boundaries of the Value Area. Traders may watch these areas when price attempts to leave or return to the previous trading range.
An HVN is a wider part of the profile where heavy historical activity occurred. These zones often develop while price consolidates. An LVN is a thinner area where comparatively little trading occurred, often because price moved through the region more quickly.
All of these should be treated as zones rather than exact prices.
This is similar to the way ordinary support and resistance are better treated as areas rather than perfect lines. Alice Blue’s guide to support and resistance trading explains how traders identify such historical reaction zones using price structure.
A beginner does not need a complicated system. A practical process is:
This prevents a Volume Profile strategy from becoming a simple “touch the level and enter” approach.
A Value Area rejection setup occurs when price tests VAH or VAL but fails to remain outside the previous Value Area.
Suppose price moves from inside the Value Area toward VAH. It briefly trades above VAH but then falls back below it and returns inside the range. Traders may interpret that behaviour as rejection of the higher price area.
If price begins moving back through the Value Area, the POC may become the next important reference zone. It should not be treated as a guaranteed target.
The opposite can happen near VAL. If price moves below VAL but quickly recovers back inside the previous Value Area, traders may view that as rejection of lower prices.
A touch of VAH or VAL alone is usually weak information. A failed breakout, rejection candle, changing market structure, or supporting volume gives the setup more context.
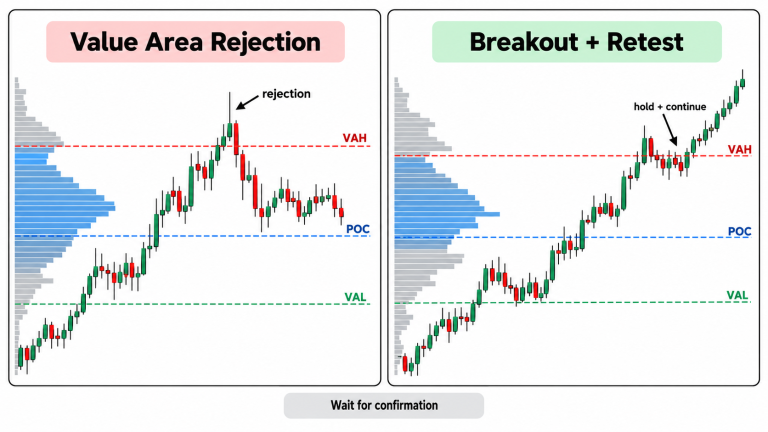
A breakout setup develops when price leaves the Value Area and continues trading outside it instead of immediately returning inside.
Suppose price moves above VAH and remains there. In simple terms, this suggests that the market is continuing to trade at prices above the previous Value Area rather than immediately rejecting them.
Some traders wait for price to return toward VAH instead of chasing the first breakout. If the former Value Area boundary holds during the retest and price starts moving higher again, the breakout has additional confirmation.
The same idea applies below VAL. If price falls below the Value Area, continues trading there, and later fails to recover above VAL, traders may watch for continued weakness.
Ordinary volume can help judge participation during these moves. Alice Blue’s guide on intraday indicators and buy-sell signals explains why volume, VWAP, and price behaviour are generally more useful when read together rather than as isolated signals.
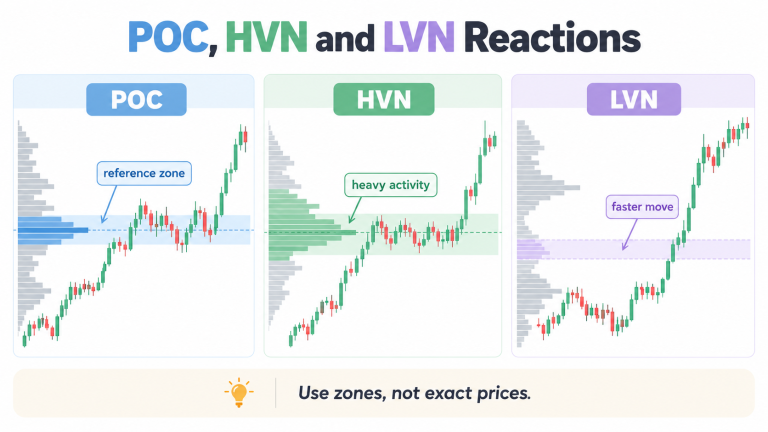
POC, HVNs, and LVNs provide different information about historical market activity.
A POC or HVN represents an area where considerable trading previously occurred. If price returns, traders may watch whether it slows down, consolidates, rejects the area, or moves through it without much difficulty.
An LVN represents an area where relatively little historical volume occurred. Price may sometimes move through such a zone quickly or react around its edges because the market previously spent less time trading there.
The mistake is assuming that history must repeat. An HVN does not automatically become support, and price does not have to move rapidly through every LVN.
The profile identifies a historically important area. The current price reaction tells you whether that area still matters.
Suppose a stock has traded between ₹900 and ₹1,000 for several weeks. Its Volume Profile shows a POC near ₹950, VAH at ₹975, VAL at ₹925, an HVN around ₹945 to ₹955, and an LVN between ₹980 and ₹990.
The stock is currently trading near ₹970.
Price moves above ₹975 but quickly falls back below it. A bearish rejection develops and the stock returns inside the Value Area.
A trader may now watch whether price begins moving back toward the POC near ₹950. If price instead moves above the rejection high and remains there, the original rejection idea may no longer make sense.
Now suppose price moves above ₹975 and continues trading there. It later returns toward ₹975, holds the area, and begins rising again.
This is different from the first scenario because price is showing more willingness to remain above the previous Value Area.
The LVN between ₹980 and ₹990 may also provide context because relatively little historical activity occurred there.
Neither scenario guarantees an outcome. Volume Profile simply helps structure the analysis around meaningful price zones.
The profile should match the type of trade you are analysing.
For a swing setup, Fixed Range Volume Profile is often useful because it allows the trader to measure a specific rally, decline, or consolidation. The starting and ending points matter because changing them can alter the POC, VAH, VAL, and volume nodes.
The profile should therefore be anchored to a logical market structure, such as a complete swing, major trend leg, or consolidation. Moving the range simply because another starting point creates more convenient levels can introduce bias.
For intraday analysis, Session Volume Profile may be more relevant because it focuses on activity during individual trading sessions.
Volume and Volume Profile should also not be confused with Open Interest when analysing futures or options. Volume measures how many contracts traded, while Open Interest shows how many contracts remain open. Alice Blue’s guide on Open Interest and Volume in options trading explains this distinction in more detail.
Volume Profile can help identify possible trade locations, but the stop-loss should be based on where the actual trade idea becomes invalid.
For a VAH rejection setup, the stop may be placed beyond the rejection structure rather than directly on VAH. For a breakout-and-retest setup, the trade may become invalid if price moves back inside the previous Value Area and fails to recover.
Possible target areas may include the POC, the opposite boundary of the Value Area, another major HVN or LVN, or a previous swing high or low.
A target should also offer a sensible reward compared with the amount being risked. A technically interesting Volume Profile level is not enough reason to take a trade if the risk is excessive.
SEBI advises market participants to understand their risk appetite and the possibility of market, liquidity, and volatility losses before trading or investing. Its guide on key risks in the securities market provides the primary regulatory context for these risks.
A Volume Profile strategy is not simply about buying or selling at POC, VAH, VAL, HVNs, or LVNs.
These areas show where the market previously traded heavily or lightly. Their real value is in helping traders identify price zones where a meaningful reaction may deserve attention.
A more disciplined process is to choose a logical profile, mark the important zones, wait for price to reach them, observe whether the market rejects or continues trading beyond the area, and then manage the trade with a clear invalidation point.
Used this way, Volume Profile adds useful context to price analysis without pretending to predict the next market move.
A Volume Profile strategy uses historical trading volume at different price levels to identify areas where traders may watch for rejection, breakouts, consolidation, or continuation.
There is no single best setup. Common approaches include Value Area rejection, breakout-and-retest setups, and reactions around POC, HVNs, and LVNs.
It can act as an important reference area because it represents the highest-volume row in the selected profile, but it is not guaranteed support or resistance.
If price moves above VAH and continues trading there, traders may interpret it as greater acceptance above the previous Value Area. A quick move back inside can instead suggest rejection.
A sustained move below VAL can show trading activity shifting below the previous Value Area, while a quick recovery back inside can suggest rejection of lower prices.
Attention Investors!
Stock Brokers can accept securities as margin from clients only by way of pledge in the depository system w.e.f. September 1, 2020. Update your mobile number & email Id with your stock broker/depository participant and receive OTP directly from the depository on your email id and/or mobile number to create a pledge. Pay 20% upfront margin of the transaction early to trade in the cash market segment. Investors may please refer to the Exchange’s Frequently Asked Questions (FAQs) issued vide circular reference NSE/INSP/45191 dated July 31, 2020, and NSE/INSP/45534 dated August 31, 2020, and other guidelines issued from time to time in this regard. Check your Securities /MF/ Bonds in the consolidated account statement issued by NSDL/CDSL every month.
Corporate Office: No. 153/2, 3rd Floor, M.R.B.Arcade, Bagalur Main Road, Dwaraka Nagar, Yelahanka, Bengaluru – 560 063, Karnataka.
Registered Office: Old No.56/2 ,New No.58, LIC Nagar, Vinayagar Kovil Street, Erode -8,Tamil Nadu– 638002.
Alice Blue Financial Services (P) Ltd : NSE EQ | NSE FO | NSE CDS-90112 SEBI REG : INZ000156038
Alice Blue Financial Services (P) Ltd : BSE EQ | BSE FO | BSE CD-6670 SEBI REG : INZ000156038
Alice Blue Financial Services (P) Ltd : CDSL DP ID 12085300 DP SEBI REG : IN-DP-364-2018
Alice Blue Financial Services (P) Ltd : MCX-56710 SEBI REG : INZ000156038
We hereby declare that we are doing PRO trading
Procedure to file a complaint on SEBI SCORES : Register on SEBI SCORES 2.0. Mandatory details for filing complaints on SCORES: Name, PAN, Address, Mobile Number, E-mail ID. Benefits: Effective Communication, Speedy redressal of the grievances
Click on the provided link to learn about the process for submitting a complaint on the ODR platform for resolving investor grievances.
Investment in securities markets are subject to market risks, read all the related documents carefully before investing. Brokerage will not exceed SEBI prescribed limit.
For queries regarding account opening or activation, email to [email protected] and for fund updates, email to [email protected]
Disclaimer : Prevent unauthorized transactions in your account. Update your mobile numbers/email IDs with your stock brokers. Receive information of your transactions directly from Exchange on your mobile/email at the end of the day. Issued in the interest of investors. All clients have to update their email id and mobile number with Member : Investor Grievance [email protected]
KYC is a one time exercise while dealing in securities markets – once KYC is done through a SEBI registered intermediary (broker, DP, Mutual Fund etc.), you need not undergo the same process again when you approach another intermediary.
No need to issue cheques by investors while subscribing to an IPO. Just write the bank account number and sign in the application form to authorise your bank to make payment in case of allotment. No worries for refund as the money remains in the investor’s account.
Investors are requested to note that Alice Blue Financial Services Private Limited is permitted to receive money from investor through designated bank accounts only named as Up streaming Client Nodal Bank Account (USCNBA). Alice Blue Financial Services Private Limited is also required to disclose these USCNB accounts to Stock Exchange. Hence, you are requested to use following USCNB accounts only for the purpose of dealings in your trading account with us. The details of these USCNB accounts are also displayed by Stock Exchanges on their website under “Know/ Locate your Stock Broker. Bank Details (Valid UPI FAQ).


