
You open a Nifty chart after a week of rising prices. Today’s candle is a thin line with tiny marks above and below it. Is the rally over?
That candle is a doji, and it only says that buyers and sellers ended the day at the same level. This guide covers the types of doji candlesticks, so you can tell the dragonfly from the gravestone and know what each one is hinting at. There are five types: standard, long-legged, dragonfly, gravestone, and four price.
A doji is a candle where the opening and closing prices are almost the same, so the body is tiny. The main types are standard, long-legged, dragonfly, and gravestone. It shows indecision, meaning neither buyers nor sellers won the period. A doji is not a buy or sell signal on its own. Check where it forms and what the next candle does.
A doji is a candle whose open and close are almost equal. It looks like a cross, a plus sign, or a “T”, depending on where the high and low sit. The word is Japanese and roughly means “the same thing”, because the open and close sit at the same level.
Price did move during the period. It just came back to where it started. On a daily chart, that means the stock swung around all day and finished flat. On a 15-minute chart, the same thing happened in 15 minutes.
Traders read this as indecision. It matters most after a clear rise or fall, because a move that stalls often changes pace.
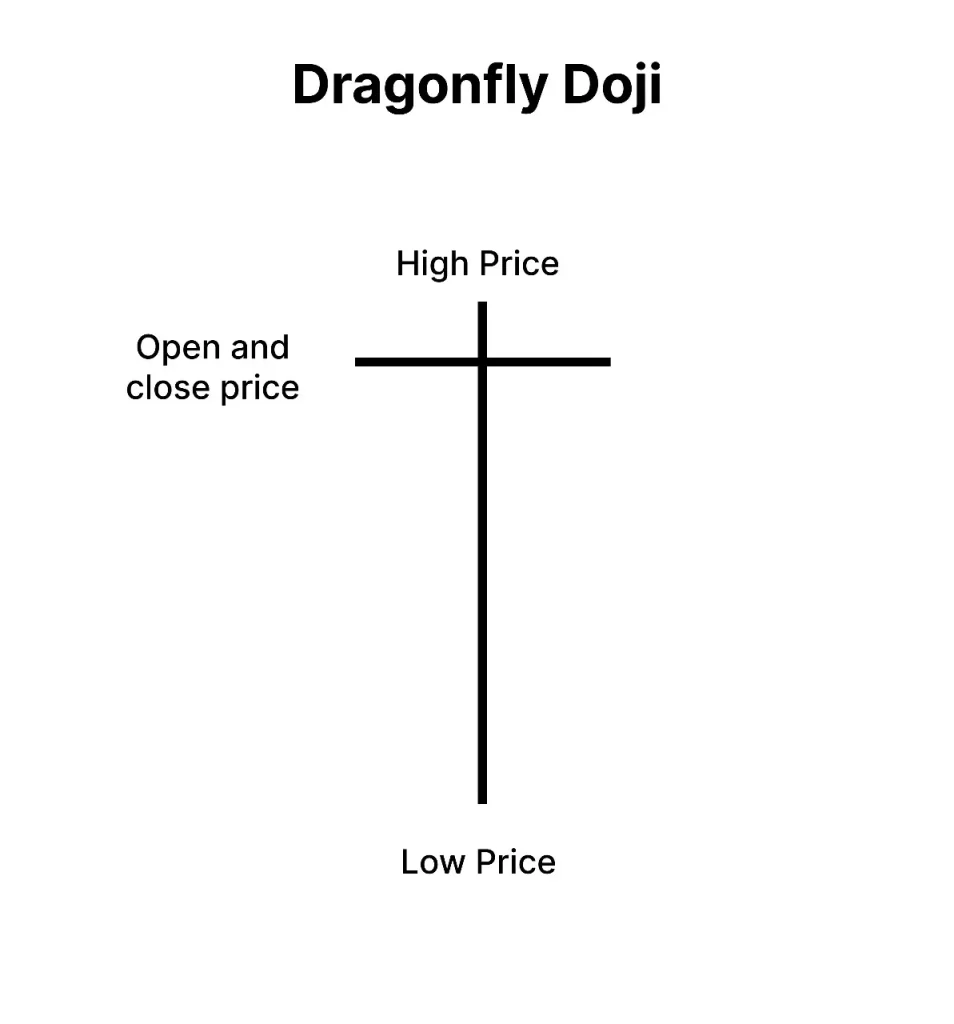
A candle records four prices: open, high, low, and close.
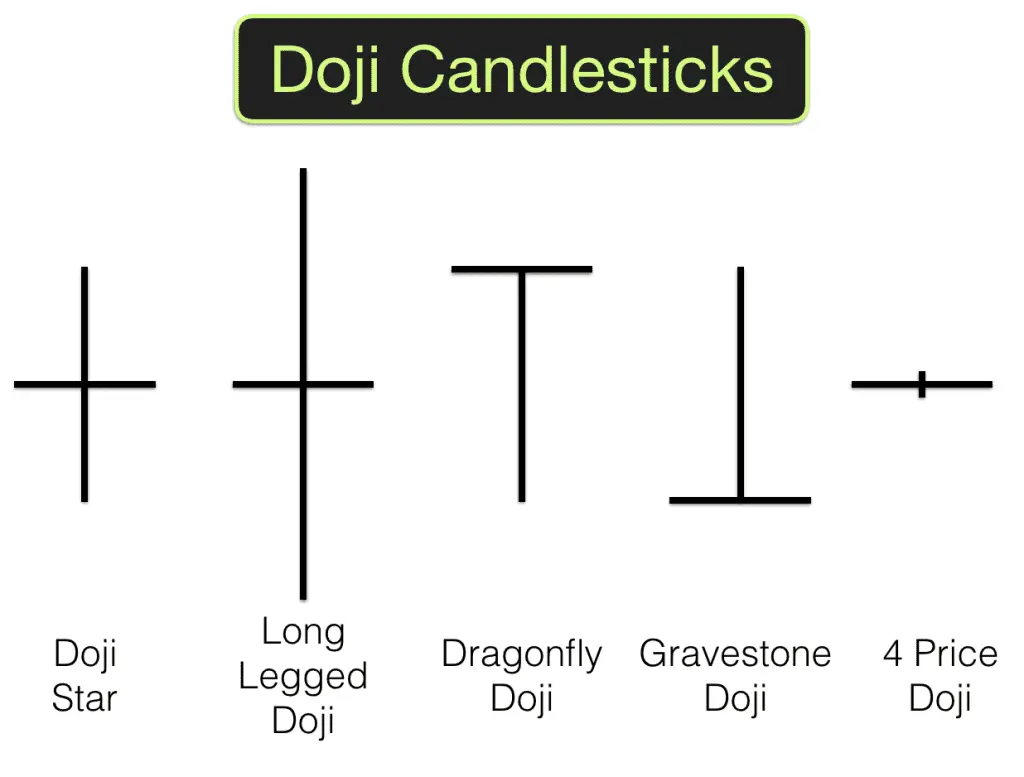
How small is “almost equal”? One guide says the body should be under 5% of the candle’s full high-to-low range. If a candle runs from ₹100 to ₹110, the range is ₹10, so a doji’s body would be about 50 paise or less. Treat that as a rule of thumb, since not every educator uses the same cutoff.
The type depends on the length and position of the wicks.
Type | Looks like | What it shows |
Standard doji | A cross with wicks of similar length | Plain indecision |
Long legged doji | A cross with very long wicks | Big swings both ways, no winner |
Dragonfly doji | “T” shape, long lower wick | Sellers pushed down, buyers brought it back |
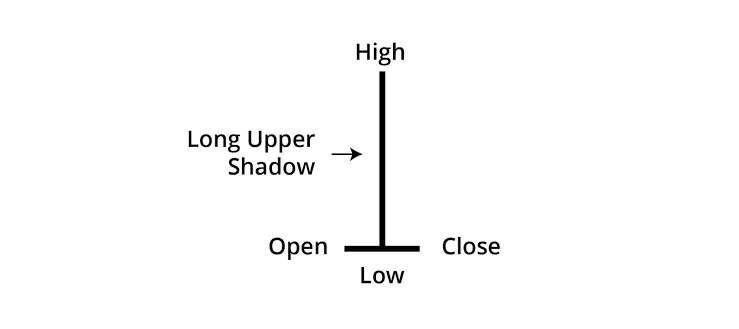
Gravestone doji | Upside-down “T”, long upper wick | Buyers pushed up, sellers brought it back |
Four price doji | A flat line | Open, high, low, and close are equal |
The wicks are about equal. Neither side showed strength, so the candle tells you little unless it follows a strong move.

Both wicks are very long. Price ran far in each direction and still closed near the open. Educators describe this as a big battle with no winner.

The open, high, and close sit near the top, with a long lower wick. Sellers pushed the price down, and buyers took back the whole fall. Near support after a decline, it suggests selling pressure may be easing. It looks like a hammer, but a dragonfly has almost no body.
The open, low, and close sit near the bottom, with a long upper wick. Buyers pushed the price up, and sellers pulled it all the way back. Near resistance after a rise, it suggests buying pressure may be fading.
A single horizontal line with no wicks at all. It is very rare and mostly seen in extremely thin trading or a circuit session.

A doji is a warning flag, not an entry. Check these in order.
Begin with daily charts. Minute charts throw up many dojis that mean very little.
This example uses made-up prices to show the logic. It is not a live quote.
A large private bank stock falls from ₹1,600 to ₹1,520 over six sessions. ₹1,500 has held as support twice in the last three months. On day seven, the stock opens at ₹1,520, drops to ₹1,495, recovers, and closes at ₹1,520. That is a dragonfly doji with a low of ₹1,495.
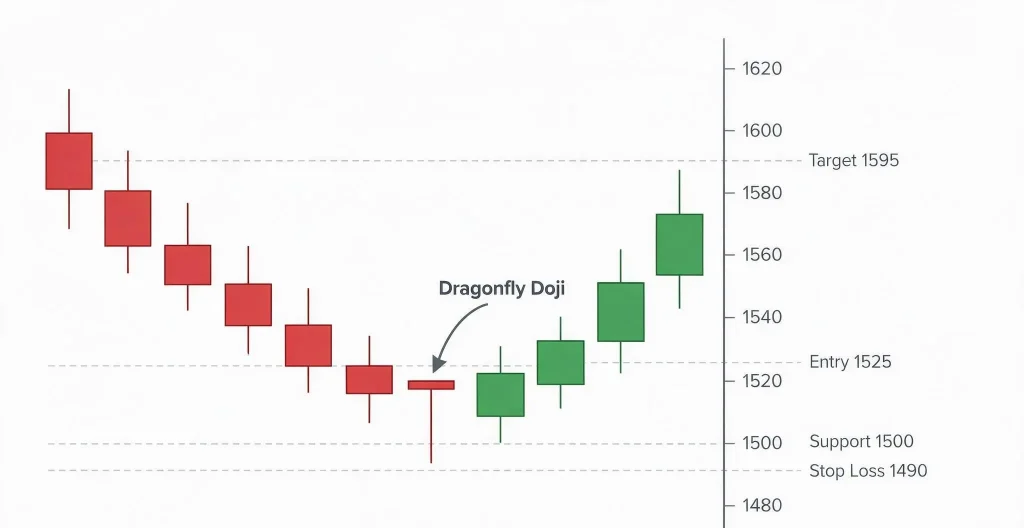
Item | Price |
Day eight must close above | ₹1,520 |
Entry | ₹1,525 |
Stop loss | ₹1,490 |
Risk per share | ₹35 |
Target | ₹1,595 |
Reward per share | ₹70 |
Risk reward | 1:2 |
With 100 shares, the planned loss is ₹3,500, and the planned gain is ₹7,000, before brokerage and taxes. If day eight closes below ₹1,495, the setup has failed. You skip it, or exit if you are already in.
The decision came from the fall before the doji, the support level, and the next candle. The doji alone did not decide it.
Parameter | Doji | Spinning top | Hammer |
Body | Almost none | Small but visible | Small, near the top |
Wicks | Depends on the type | Both sides, moderate | Long lower, short or none upper |
What it hints | Indecision | Mild indecision | Possible bounce after a fall |
Where it matters | Support, resistance, after a trend | After a trend | End of a downtrend |
Next candle needed | Yes | Yes | Yes |
A quick test: no visible body means doji. A small body with wicks on both sides means spinning top. A small body with a long lower wick means hammer. A spinning top has a visible body, while a doji has essentially none.
Swing and positional traders who use daily charts get the most from dojis. Beginners learning price action can use them to see how buyers and sellers behave. Long-term investors can watch weekly dojis on index charts as a caution sign before adding money.
Scalpers and very short-term intraday traders will find them less useful, because dojis are frequent on small timeframes. Anyone who wants a strict, rule-based signal should also be careful, because reading a doji takes judgement.
A doji tells you the market paused. Standard and long-legged dojis show confusion. A dragonfly leans bullish near support, and a gravestone leans bearish near resistance. None of them is a trade by itself. Check the trend before it, the price level, and the next candle’s close. Set a stop loss, keep the position small, and test your reading on past charts.
There are five: standard, long-legged, dragonfly, gravestone, and four price. They differ in the length and position of their wicks. The four price doji is rare.
By itself, it is neither. A dragonfly near support after a fall leans bullish, and a gravestone near resistance after a rise leans bearish. Wait for the next candle to confirm.
None is reliable alone. Dragonfly and gravestone dojis give a clearer read because one side was rejected. Even so, one study found the dragonfly reversed only about 50% of the time, so location and confirmation matter more than the shape.
A hammer has a small visible body and a long lower wick. A dragonfly doji has almost no body. Both look similar, and both need confirmation.
Yes. A doji on higher-than-usual volume carries more weight. One on low volume is often just a quiet session.
Start with daily charts. Intraday dojis are frequent and carry less meaning.
Attention Investors!
Stock Brokers can accept securities as margin from clients only by way of pledge in the depository system w.e.f. September 1, 2020. Update your mobile number & email Id with your stock broker/depository participant and receive OTP directly from the depository on your email id and/or mobile number to create a pledge. Pay 20% upfront margin of the transaction early to trade in the cash market segment. Investors may please refer to the Exchange’s Frequently Asked Questions (FAQs) issued vide circular reference NSE/INSP/45191 dated July 31, 2020, and NSE/INSP/45534 dated August 31, 2020, and other guidelines issued from time to time in this regard. Check your Securities /MF/ Bonds in the consolidated account statement issued by NSDL/CDSL every month.
Corporate Office: No. 153/2, 3rd Floor, M.R.B.Arcade, Bagalur Main Road, Dwaraka Nagar, Yelahanka, Bengaluru – 560 063, Karnataka.
Registered Office: Old No.56/2 ,New No.58, LIC Nagar, Vinayagar Kovil Street, Erode -8,Tamil Nadu– 638002.
Alice Blue Financial Services (P) Ltd : NSE EQ | NSE FO | NSE CDS-90112 SEBI REG : INZ000156038
Alice Blue Financial Services (P) Ltd : BSE EQ | BSE FO | BSE CD-6670 SEBI REG : INZ000156038
Alice Blue Financial Services (P) Ltd : CDSL DP ID 12085300 DP SEBI REG : IN-DP-364-2018
Alice Blue Financial Services (P) Ltd : MCX-56710 SEBI REG : INZ000156038
We hereby declare that we are doing PRO trading
Procedure to file a complaint on SEBI SCORES : Register on SEBI SCORES 2.0. Mandatory details for filing complaints on SCORES: Name, PAN, Address, Mobile Number, E-mail ID. Benefits: Effective Communication, Speedy redressal of the grievances
Click on the provided link to learn about the process for submitting a complaint on the ODR platform for resolving investor grievances.
Investment in securities markets are subject to market risks, read all the related documents carefully before investing. Brokerage will not exceed SEBI prescribed limit.
For queries regarding account opening or activation, email to [email protected] and for fund updates, email to [email protected]
Disclaimer : Prevent unauthorized transactions in your account. Update your mobile numbers/email IDs with your stock brokers. Receive information of your transactions directly from Exchange on your mobile/email at the end of the day. Issued in the interest of investors. All clients have to update their email id and mobile number with Member : Investor Grievance [email protected]
KYC is a one time exercise while dealing in securities markets – once KYC is done through a SEBI registered intermediary (broker, DP, Mutual Fund etc.), you need not undergo the same process again when you approach another intermediary.
No need to issue cheques by investors while subscribing to an IPO. Just write the bank account number and sign in the application form to authorise your bank to make payment in case of allotment. No worries for refund as the money remains in the investor’s account.
Investors are requested to note that Alice Blue Financial Services Private Limited is permitted to receive money from investor through designated bank accounts only named as Up streaming Client Nodal Bank Account (USCNBA). Alice Blue Financial Services Private Limited is also required to disclose these USCNB accounts to Stock Exchange. Hence, you are requested to use following USCNB accounts only for the purpose of dealings in your trading account with us. The details of these USCNB accounts are also displayed by Stock Exchanges on their website under “Know/ Locate your Stock Broker. Bank Details (Valid UPI FAQ).


