
Have you ever seen three strong green candles in a row after a fall in a stock price and wondered if the trend is finally turning up? That setup is often the Three White Soldiers candlestick pattern, a bullish reversal signal many beginners look for. If you are learning candlestick patterns for NSE stocks, this guide explains the Three White Soldiers candlestick pattern in simple steps with Indian examples. By the end, you will know how to identify this pattern on Indian charts, when to avoid it, and how to plan entry, stop loss, and target with a simple example.
What Is the Three White Soldiers Candlestick Pattern
How Does the Three White Soldiers Pattern Work (Step by Step)
Practical Example With Numbers (Real Indian Stock Example)
Key Features and Characteristics
Advantages of Using This Pattern
Risks and Limitations
Tips for Beginners
Three White Soldiers vs Morning Star: What Is the Difference
Common Mistakes to Avoid
Who Should Use This Pattern
Conclusion
Frequently Asked Questions
The Three White Soldiers candlestick pattern is a bullish reversal pattern made of three consecutive long green or white candles that form after a downtrend. Each candle opens within the body of the previous one and closes near its high, showing steady buying pressure over three sessions.
In simple words, it is a three-candle pattern that suggests the fall in price may be over, and an upward move may start. Think of it as three strong up days in a row after a fall, where each day closes near its high. For beginners learning candlestick patterns for beginners, this is one of the clearer patterns to recognise on daily or intraday charts.

Here is how the pattern forms and what each step means in practice. You can see this pattern on 15-minute, hourly, daily, or weekly charts. For beginners, daily charts are usually easier to read.
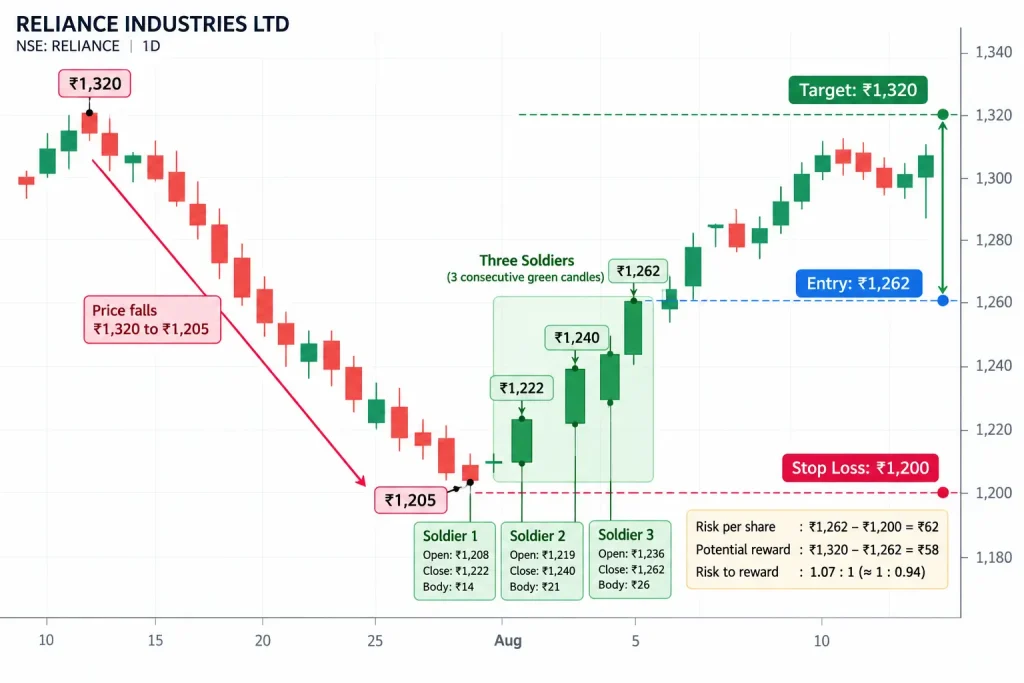
Imagine Reliance Industries has fallen from ₹1,320 to ₹1,205. Three green candles then form:
Candle | Open | Close | Body size |
Soldier 1 | ₹1,208 | ₹1,222 | ₹14 |
Soldier 2 | ₹1,219 | ₹1,240 | ₹21 |
Soldier 3 | ₹1,236 | ₹1,262 | ₹26 |
Each candle opens within the previous candle’s body and closes higher. In this illustration, the third candle also moves above a reference level at ₹1,255.
A trader studying this setup might consider an entry near ₹1,262 after confirmation. For illustration, suppose the stop loss is ₹1,200, and the target is ₹1,320.
Risk per share: ₹1,262 minus ₹1,200 = ₹62.
Potential reward per share: ₹1,320 minus ₹1,262 = ₹58.
Risk to potential reward: about 1.07 to 1, or roughly 1:0.94.
This calculation excludes brokerage, taxes, slippage, and other trading costs. The example does not show that the setup occurred or that the trade would have succeeded. In a real chart, check the dated candle data and choose levels based on the actual chart.
Both are bullish reversal patterns, but they look and behave differently. Many beginners search for Three White Soldiers vs Morning Star to understand which one to use.
Parameter | Three White Soldiers | Morning Star |
Number of candles | 3 green candles in a row | 3 candles: long red, small body, long green |
Shape | Steady upward staircase of green candles | Gap down, small middle candle, strong green close |
Signal strength | Shows continuous buying over 3 sessions | Shows exhaustion of sellers, then strong buyer entry |
Best used in | Clear downtrend with strong follow-through | Sharp fall, then consolidation, then strong bounce |
Complexity for beginners | Easier to spot (three similar candles) | Slightly more complex (three different candle types) |
For a deeper dive, see our article on Morning Star vs Three White Soldiers and the broader candlestick patterns guide.
Avoid these pitfalls by following a checklist. Our trading checklist for beginners can help.
It is less suitable for:
If you are starting, begin with our stock market for beginners and basic technical analysis course.
The Three White Soldiers candlestick pattern is a straightforward bullish reversal signal that shows strong buying over three consecutive candles after a downtrend. For beginners in India, it offers a clear visual way to spot potential trend changes on NSE and BSE stocks. Used with volume checks, support and resistance levels, and proper stop-loss, it can be a useful part of a simple trading plan. Remember, no pattern works all the time. Treat it as one tool among many, not a standalone system.
Yes, it is one of the easier bullish reversal patterns to learn because of its clear three-candle structure. However, beginners should first understand basic candlesticks, support and resistance, and risk management before trading it live.
It can work on intraday timeframes like 15-minute or hourly charts, but signals are often more reliable on daily and weekly charts where there is less noise. Intraday traders should use strict stop loss and volume confirmation.
Three White Soldiers is a bullish reversal pattern with three green candles after a downtrend. Three Black Crows is the opposite: a bearish reversal pattern with three red candles after an uptrend.
A long upper wick on the third candle suggests that buyers pushed price up, but sellers came back before the close. This weakens the pattern, and traders should be more cautious or wait for extra confirmation.
Yes, you can use this pattern on Nifty, Bank Nifty, and individual stocks listed on NSE and BSE. The rules remain the same: look for three long green candles after a clear downtrend, with volume confirmation.
Yes. Combining the pattern with volume, moving averages, RSI, or nearby support/resistance levels improves confidence and helps filter out false signals.
Attention Investors!
Stock Brokers can accept securities as margin from clients only by way of pledge in the depository system w.e.f. September 1, 2020. Update your mobile number & email Id with your stock broker/depository participant and receive OTP directly from the depository on your email id and/or mobile number to create a pledge. Pay 20% upfront margin of the transaction early to trade in the cash market segment. Investors may please refer to the Exchange’s Frequently Asked Questions (FAQs) issued vide circular reference NSE/INSP/45191 dated July 31, 2020, and NSE/INSP/45534 dated August 31, 2020, and other guidelines issued from time to time in this regard. Check your Securities /MF/ Bonds in the consolidated account statement issued by NSDL/CDSL every month.
Corporate Office: No. 153/2, 3rd Floor, M.R.B.Arcade, Bagalur Main Road, Dwaraka Nagar, Yelahanka, Bengaluru – 560 063, Karnataka.
Registered Office: Old No.56/2 ,New No.58, LIC Nagar, Vinayagar Kovil Street, Erode -8,Tamil Nadu– 638002.
Alice Blue Financial Services (P) Ltd : NSE EQ | NSE FO | NSE CDS-90112 SEBI REG : INZ000156038
Alice Blue Financial Services (P) Ltd : BSE EQ | BSE FO | BSE CD-6670 SEBI REG : INZ000156038
Alice Blue Financial Services (P) Ltd : CDSL DP ID 12085300 DP SEBI REG : IN-DP-364-2018
Alice Blue Financial Services (P) Ltd : MCX-56710 SEBI REG : INZ000156038
We hereby declare that we are doing PRO trading
Procedure to file a complaint on SEBI SCORES : Register on SEBI SCORES 2.0. Mandatory details for filing complaints on SCORES: Name, PAN, Address, Mobile Number, E-mail ID. Benefits: Effective Communication, Speedy redressal of the grievances
Click on the provided link to learn about the process for submitting a complaint on the ODR platform for resolving investor grievances.
Investment in securities markets are subject to market risks, read all the related documents carefully before investing. Brokerage will not exceed SEBI prescribed limit.
For queries regarding account opening or activation, email to [email protected] and for fund updates, email to [email protected]
Disclaimer : Prevent unauthorized transactions in your account. Update your mobile numbers/email IDs with your stock brokers. Receive information of your transactions directly from Exchange on your mobile/email at the end of the day. Issued in the interest of investors. All clients have to update their email id and mobile number with Member : Investor Grievance [email protected]
KYC is a one time exercise while dealing in securities markets – once KYC is done through a SEBI registered intermediary (broker, DP, Mutual Fund etc.), you need not undergo the same process again when you approach another intermediary.
No need to issue cheques by investors while subscribing to an IPO. Just write the bank account number and sign in the application form to authorise your bank to make payment in case of allotment. No worries for refund as the money remains in the investor’s account.
Investors are requested to note that Alice Blue Financial Services Private Limited is permitted to receive money from investor through designated bank accounts only named as Up streaming Client Nodal Bank Account (USCNBA). Alice Blue Financial Services Private Limited is also required to disclose these USCNB accounts to Stock Exchange. Hence, you are requested to use following USCNB accounts only for the purpose of dealings in your trading account with us. The details of these USCNB accounts are also displayed by Stock Exchanges on their website under “Know/ Locate your Stock Broker. Bank Details (Valid UPI FAQ).


