


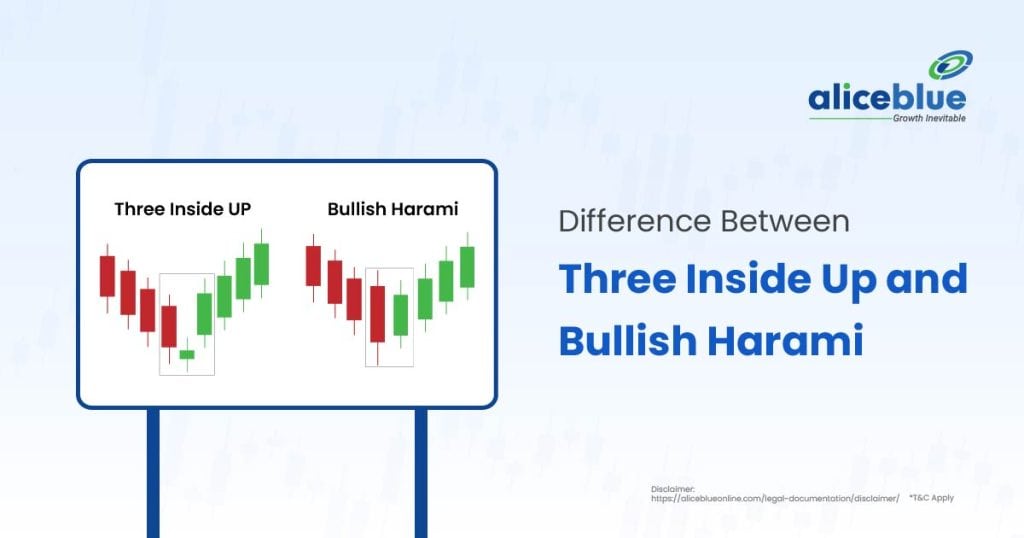
The main difference between Three Inside Up and Bullish Harami is confirmation. Three Inside Up requires a third bullish candle to confirm reversal, while Bullish Harami forms with two candles and lacks immediate confirmation. Traders rely on Three Inside Up for stronger trend reversal signals.
Contents:
- Three Inside Up Meaning
- Bullish Harami Meaning
- Difference Between Three Inside Up and Bullish Harami
- Characteristics of Three Inside Up
- Characteristics of Bullish Harami
- How to Identify a Three Inside Up Pattern?
- How to Identify a Bullish Harami Pattern?
- Trading Strategies for Three Inside Up
- Trading Strategies for Bullish Harami
- Difference Between Three Inside Up and Bullish Harami – Quick Summary
- Three Inside Up vs Bullish Harami – FAQs
Three Inside Up Meaning
Three Inside Up is a bullish reversal pattern that indicates a trend shift from bearish to bullish. It consists of three candles: a small bullish candle inside a larger bearish one, followed by a third bullish candle closing above the second.
This pattern forms after a downtrend and signals weakening selling pressure. The first candle reflects a strong bearish momentum. The second, a small bullish candle, shows hesitation among sellers. The third bullish candle confirms buyers are taking control by closing above the previous one. Traders use this pattern to spot potential reversals and entry points. It gains reliability when supported by high trading volume and other technical indicators. When it appears near key support levels, the chances of a strong bullish reversal increase significantly.


Bullish Harami Meaning
Bullish Harami is a two-candle pattern that signals potential reversal from bearish to bullish. It forms when a small bullish candle appears inside a larger bearish candle. This pattern indicates that selling pressure is weakening, and buyers are starting to regain control of the market.
This pattern appears after a downtrend and suggests a slowdown in selling momentum. The first bearish candle shows strong selling pressure. The second, a smaller bullish candle, fits within the first, signaling hesitation among sellers. Unlike Three Inside Up, Bullish Harami lacks immediate confirmation. Traders look for additional indicators like volume and support levels to confirm a trend reversal. When followed by a bullish breakout, it strengthens the reversal signal. This pattern is most effective when combined with other technical analysis tools.

Difference Between Three Inside Up and Bullish Harami
The major difference between Three Inside Up and Bullish Harami is that Three Inside Up confirms a trend reversal with three candles, while Bullish Harami has only two and lacks immediate confirmation. Three Inside Up is more reliable, making it a stronger signal for traders.
| Parameter | Three Inside Up | Bullish Harami |
| Number of Candles | Three candles form the pattern | Two candles form the pattern |
| Confirmation | Requires a third bullish candle closing higher for confirmation | No immediate confirmation; traders seek additional signals |
| Strength of Signal | Stronger bullish reversal signal | Weaker reversal signal, needs validation |
| First Candle | Large bearish candle indicating strong selling pressure | Large bearish candle showing downward momentum |
| Second Candle | Small bullish candle forming within the first | Small bullish candle forming inside the first |
| Third Candle | A bullish candle closing above the second, confirming reversal | No third candle; traders rely on follow-up price action |
| Reliability | High reliability, especially with volume confirmation | Less reliable alone; works better with support levels and indicators |
| Best Trading Approach | Suitable for confident long positions after confirmation | Requires cautious trading with additional technical indicators |
| Market Context | More effective in strong downtrends where reversal is expected | Appears in weaker downtrends or market consolidation phases |
| Risk Factor | Lower risk due to strong confirmation | Higher risk since false signals are possible |
| Usage by Traders | Used when traders seek clear confirmation of trend reversal | Preferred by traders willing to take early reversal signals |
Characteristics of Three Inside Up
The primary characteristic of Three Inside Up is that it confirms a bullish reversal with three candles. It appears after a downtrend and signals shift in market sentiment. This pattern strengthens when the third candle closes higher, indicating buyers gaining control and reducing selling pressure.
- Three-Candle Formation: This pattern consists of three candles forming in a specific sequence. The first is a large bearish candle, showing strong selling pressure. The second is a small bullish candle that stays within the first, signaling hesitation. The third is a bullish candle that closes above the second, confirming the reversal.
- Signals a Bullish Reversal: Three Inside Up appears after a downtrend and signals a potential reversal. It indicates that sellers are losing control, and buyers are stepping in. Traders look for this pattern at support levels to confirm a shift in momentum. Strong volume on the third candle increases reliability.
- Confirmation with Third Candle: The third candle plays a crucial role in validating the pattern. It must be bullish and close above the second candle. This confirms that buying pressure is increasing. Without this confirmation, the reversal may be weak, and traders often wait for further price action before taking positions.
- Works Best with Volume Increase: High trading volume on the third candle strengthens the pattern’s reliability. A rise in volume confirms that buyers are actively pushing prices higher. If volume remains low, the pattern may not be as effective. Traders use volume analysis to avoid false signals and improve decision-making.
- More Effective at Support Levels: This pattern is stronger when it forms near key support levels. Support areas indicate where buyers are likely to enter the market. If Three Inside Up appears at a strong support zone, the chances of a successful bullish reversal increase. Traders combine this with trendlines and moving averages.
- Used in Trend Reversals: Three Inside Up is commonly used to identify trend reversals in stocks, forex, and commodities. Traders look for this pattern when a downtrend shows signs of exhaustion. It helps them enter early into a potential uptrend. Confirmation with other indicators enhances its effectiveness.
- Reliable for Short-Term Trading: This pattern is useful for short-term traders looking for quick reversals. Since it provides a clear signal within three candles, traders use it for swing trading and intraday strategies. However, they combine it with risk management techniques to minimize losses from false breakouts.
Characteristics of Bullish Harami
The main characteristic of Bullish Harami is that it consists of two candles, where a small bullish candle forms inside a larger bearish one. This pattern signals weakening selling pressure and possible trend reversal. Traders use it to identify early signs of bullish momentum.
- Two-Candle Reversal Pattern: Bullish Harami is a two-candle pattern that forms during a downtrend. The first candle is large and bearish, indicating strong selling pressure. The second candle is small and bullish, forming within the body of the first. This signals that sellers are losing strength, and buyers are beginning to step in.
- Indicates Potential Reversal: This pattern suggests that a downtrend may be weakening. When a small bullish candle forms inside the previous bearish one, it shows hesitation among sellers. Although this does not guarantee an immediate reversal, it alerts traders to a possible shift in momentum. Additional confirmation improves its reliability.
- Lacks Immediate Confirmation: Unlike Three Inside Up, Bullish Harami does not provide instant confirmation of a trend reversal. Traders often wait for the next candle to see if the price moves upward. Without a strong follow-up bullish candle, the pattern alone may not be enough to confirm a trend change.
- Works Best at Support Levels: This pattern gains strength when it forms near key support zones. A support level increases the chances of a successful reversal as buyers tend to enter the market at these points. If Bullish Harami appears at a strong support level, traders watch for further bullish confirmation before entering a trade.
- Volume Analysis Improves Accuracy: Trading volume plays a crucial role in confirming the pattern’s reliability. If volume rises during or after the second candle, it indicates stronger buying interest. A low-volume Harami may not be as effective, as it could be a temporary pause rather than a real shift in trend.
- Used for Early Entry Signals: Traders use Bullish Harami to identify early signs of a trend reversal. Since it forms before a confirmed uptrend, it allows traders to enter positions at an early stage. However, they combine it with other indicators like moving averages or RSI to avoid false breakouts.
- Less Reliable Than Three Inside Up: While Bullish Harami suggests a potential reversal, it is weaker compared to Three Inside Up. Since it lacks a third confirming candle, traders need to be cautious. They often look for additional bullish signals, such as a breakout above resistance or strong follow-up buying pressure, to confirm the pattern.
How to Identify a Three Inside Up Pattern?
The ideal way to identify a Three Inside Up pattern is to find three candles after a downtrend. The first is a large bearish candle, the second is a small bullish candle inside it, and the third is a bullish candle closing above the second.
- Formation After a Downtrend: This pattern must appear after a prolonged downtrend. A clear downward movement signals strong selling pressure. The presence of Three Inside Up indicates that sellers are losing control. If the pattern emerges in an uptrend or sideways market, it does not hold the same significance.
- First Candle as a Strong Bearish Candle: The first candle must be large and bearish, representing strong downward momentum. It shows that sellers dominated the market before the pattern formed. This candle is essential because it sets the stage for the potential reversal. Without a strong bearish candle, the pattern loses reliability.
- Second Candle as a Small Bullish Candle: The second candle should be bullish and smaller than the first. It must form within the body of the previous bearish candle. This signals a slowdown in selling pressure. The smaller size indicates that buyers are beginning to push back but have not yet taken full control.
- Third Candle Closing Above the Second Candle: The third candle must be bullish and close above the second candle’s high. This confirms that buyers have gained control. If the third candle fails to close higher, the pattern is incomplete. A strong closing price strengthens the reversal signal and increases the pattern’s reliability.
- Higher Trading Volume on the Third Candle: A rise in trading volume on the third candle supports the pattern’s validity. Increased volume shows strong buying interest and confirms the reversal. If volume remains low, the pattern may not be as effective. Traders use volume analysis to filter out weak or false signals.
- Pattern Strengthens at Key Support Levels: Three Inside Up is more effective when it appears near a strong support level. Support zones indicate areas where buyers are likely to enter. If the pattern forms at a major support level, the chances of a successful bullish reversal increase significantly, making it a strong trading opportunity.
- Confirmation Through Additional Indicators: While Three Inside Up is a strong pattern, traders confirm it with other indicators. Moving averages, RSI, or MACD can strengthen the signal. If other indicators align with the pattern, it enhances the probability of a successful trade. Traders avoid relying on this pattern alone for decisions.
How to Identify a Bullish Harami Pattern?
The best possible way to identify a Bullish Harami pattern is to look for two specific candles appearing after a downtrend. The first is a large bearish candle, followed by a smaller bullish candle within its body. This pattern signals a slowdown in selling pressure.
- Formation After a Downtrend: Bullish Harami must appear after a strong downtrend. A prior decline indicates dominant selling pressure. When this pattern forms, it suggests that sellers are losing strength. If it appears in an uptrend or a sideways market, it does not carry the same significance for traders.
- First Candle as a Large Bearish Candle: The first candle should be large and bearish, reflecting strong downward momentum. It represents aggressive selling pressure in the market. This candle is critical because it sets the stage for the potential reversal. Without a strong bearish candle, the pattern may not indicate a reliable signal.
- Second Candle as a Small Bullish Candle: The second candle must be bullish and much smaller than the first. It should form entirely within the body of the first bearish candle. This signals hesitation among sellers and early interest from buyers. A small size reflects uncertainty and the potential beginning of a trend reversal.
- Gap Between Closing and Opening Prices: The second candle typically opens within the body of the first without breaking below it. This shows reduced selling pressure. If the second candle closes near its high, it strengthens the reversal signal. Traders prefer patterns where the second candle holds within the first.
- Higher Reliability Near Support Levels: The pattern is more reliable when it appears at key support levels. Support areas indicate where buyers are likely to enter the market. If Bullish Harami forms at a strong support level, traders watch for further confirmation of a potential trend reversal before taking action.
- Increased Volume on the Second Candle: A rise in volume on the second candle improves the pattern’s reliability. Increased buying activity confirms that buyers are stepping in. If volume remains low, the pattern may indicate only temporary hesitation rather than a real shift in trend. Traders use volume to validate signals.
- Confirmation with Additional Indicators: Since Bullish Harami lacks immediate confirmation, traders combine it with other technical indicators. Moving averages, RSI, or trendlines can provide stronger signals. A breakout above a resistance level after this pattern forms increases the chances of a successful bullish reversal, helping traders make informed decisions.
Trading Strategies for Three Inside Up
The best trading strategies for Three Inside Up focus on confirming the pattern before entering a trade. Traders look for strong volume on the third candle and additional indicators for validation. Proper risk management and well-placed stop-loss levels help maximize gains while minimizing potential losses.
- Confirming with Volume and Indicators: Volume plays a crucial role in confirming this pattern. A rise in volume on the third candle strengthens the reversal signal. Traders also use moving averages, RSI, or MACD to validate the trend shift. Without confirmation, the pattern may result in a false breakout.
- Entry Point After Third Candle Closes: The safest entry point is after the third bullish candle closes above the second candle. Entering too early increases risk. Traders wait for a strong close to confirm buying pressure. If the third candle lacks momentum, they may wait for additional confirmation before placing trades.
- Placing a Stop-Loss for Risk Management: A stop-loss is essential to limit potential losses. Traders place it below the low of the first bearish candle. This ensures protection if the pattern fails and the price reverses downward. Adjusting the stop-loss based on market conditions helps manage risk effectively.
- Targeting Profits with Resistance Levels: Traders set profit targets near key resistance levels. Identifying previous price resistance helps determine potential exit points. If the stock approaches resistance with strong momentum, traders may hold longer. If momentum weakens, they secure profits early to avoid a reversal.
- Using Moving Averages for Additional Confirmation: Moving averages help validate the pattern’s strength. If the price breaks above a short-term moving average, the reversal is more reliable. A crossover of a shorter moving average above a longer one confirms an uptrend. Traders use this to strengthen their trade decisions.
- Applying the Pattern in Multiple Timeframes: Checking multiple timeframes improves trade accuracy. A Three Inside Up pattern on a daily chart is more reliable than on an hourly chart. Aligning short-term patterns with higher timeframe trends increases the probability of success and reduces the chances of false signals.
- Avoiding Trades in Weak Market Conditions: Not all Three Inside Up patterns result in strong reversals. If the market lacks momentum, the pattern may fail. Traders avoid setups in sideways or low-volume markets. They focus on patterns forming in strong downtrends, where reversals have a higher chance of success.
Trading Strategies for Bullish Harami
The best trading strategies for Bullish Harami focus on confirming the pattern before taking a position. Traders look for increased volume, follow-up bullish candles, and key support levels. Using stop-loss orders and technical indicators helps manage risk and improve the chances of a successful trade.
- Confirming with Volume and Price Action: Volume plays a key role in validating the Bullish Harami pattern. A rise in volume during or after the second candle signals stronger buying interest. Traders also watch the next few candles for follow-through bullish movement. Without confirmation, the pattern may indicate only temporary hesitation rather than a reversal.
- Waiting for a Bullish Breakout: Traders avoid entering immediately after spotting a Bullish Harami. Instead, they wait for a bullish breakout above the second candle’s high. A strong bullish close confirms the shift in market sentiment. Entering too early increases the risk of false signals and potential losses.
- Setting Stop-Loss Below Support: A stop-loss helps protect against unexpected reversals. Traders place it slightly below the lowest point of the first bearish candle. This ensures the trade remains valid only if the market follows through with the reversal. Adjusting the stop-loss based on volatility improves risk management.
- Identifying Profit Targets at Resistance: Setting profit targets at key resistance levels helps secure gains. Traders look for previous price resistance zones to determine exit points. If momentum weakens near resistance, they book profits early. If the price breaks resistance, they may hold for further upside potential.
- Using Moving Averages for Confirmation: Moving averages help validate the strength of the pattern. If the price moves above a short-term moving average after forming a Bullish Harami, it confirms buying strength. A crossover of a short-term moving average above a longer one further supports an uptrend.
- Applying the Pattern in Higher Timeframes: Checking the pattern across multiple timeframes increases reliability. A Bullish Harami on a higher timeframe, such as a daily chart, carries more weight than on a short-term chart. Aligning smaller patterns with larger trends improves accuracy and reduces false signals.
- Avoiding Trades in Weak Market Conditions: Bullish Harami patterns do not always lead to strong reversals. If the market lacks momentum, the pattern may fail. Traders avoid setups in low-volume or sideways markets. They focus on patterns forming in strong downtrends with clear signs of buying pressure for better results.
Difference Between Three Inside Up and Bullish Harami – Quick Summary
- Three Inside Up confirms a trend reversal with three candles, while Bullish Harami consists of only two and lacks immediate confirmation. Three Inside Up is more reliable, making it a stronger signal for traders.
- Three Inside Up is a bullish reversal pattern that forms after a downtrend. It consists of three candles, with the third one closing above the second to confirm the trend shift.
- Bullish Harami is a two-candle pattern signaling a potential reversal. A small bullish candle forms within a larger bearish one, showing selling pressure is weakening.
- Three Inside Up requires a third bullish candle for confirmation, while Bullish Harami does not. Three Inside Up provides a stronger signal, making it more reliable for trend reversals.
- The primary characteristic of Three Inside Up is its three-candle formation. It starts with a bearish candle, followed by a smaller bullish one, and a final bullish candle closing higher.
- The main characteristic of Bullish Harami is its two-candle structure. A small bullish candle forms inside a larger bearish one, signaling hesitation among sellers and a possible reversal.
- The ideal way to identify Three Inside Up is to look for three specific candles forming after a downtrend. The third candle must be bullish and close above the second, confirming the reversal.
- The best possible way to identify a Bullish Harami is to look for a large bearish candle followed by a small bullish candle within its body. This signals weakening selling pressure and a potential trend shift.
- The best trading strategies for Three Inside Up focus on confirmation before entering a trade. Traders use volume analysis, moving averages, and resistance levels to strengthen the signal.
- The most effective trading strategies for Bullish Harami involve waiting for a bullish breakout, using stop-loss orders, and confirming with technical indicators like moving averages or RSI.
- Spot trend reversals with patterns like Three Inside Up and Bullish Harami. With Alice Blue’s advanced charting, real-time insights, and expert tools, trading smarter is just a click away. Open your free Demat account today!

Three Inside Up vs Bullish Harami – FAQs
1. What Is The Difference Between Three Inside Up and Bullish Harami?
Three Inside Up has three candles, confirming a bullish reversal, while Bullish Harami has two candles and lacks immediate confirmation. Three Inside Up provides a stronger and more reliable reversal signal for traders.
2. What Is Three Inside Up?
Three Inside Up is a bullish reversal pattern forming after a downtrend. It consists of a bearish candle, a smaller bullish candle inside it, and a third bullish candle closing above the second.
3. What Is Bullish Harami?
Bullish Harami is a two-candle pattern signaling a potential reversal. A small bullish candle forms inside a larger bearish one, indicating weakening selling pressure and a possible shift in market sentiment.
4. Is The Three Inside Up Pattern Reliable?
Yes, Three Inside Up is a reliable bullish reversal pattern. It provides strong confirmation with three candles, and its accuracy increases when supported by high trading volume and key technical indicators.
5. What Happens After A Three Inside Up Pattern?
After a Three Inside Up pattern, prices usually move higher as buyers gain control. A sustained uptrend depends on market conditions, volume confirmation, and resistance levels influencing further price movement.
6. What Happens After A Bullish Harami Pattern?
After a Bullish Harami pattern, the market may reverse or consolidate. Confirmation from the next candles is essential, as the pattern alone does not guarantee a strong bullish trend continuation.
7. Is Three Inside Up A Stronger Signal Than Bullish Harami?
Yes, Three Inside Up is a stronger signal than Bullish Harami. It includes a confirming third bullish candle, increasing reliability, while Bullish Harami lacks immediate confirmation and requires additional validation.
8. What Does A Three Inside Up Pattern Indicate?
Three Inside Up indicates a shift from bearish to bullish momentum. It shows that selling pressure is fading, and buyers are gaining strength, signaling a potential trend reversal in the market.
9. What Is The Opposite Of The Bullish Harami Pattern?
The opposite of Bullish Harami is Bearish Harami. It consists of a large bullish candle followed by a smaller bearish candle inside it, signaling a potential bearish reversal after an uptrend.
10. What Does A Bullish Harami Pattern Indicate?
A Bullish Harami pattern indicates weakening selling pressure and potential reversal. It suggests buyers are entering the market, but confirmation from the next candles is needed for a strong bullish move.





