


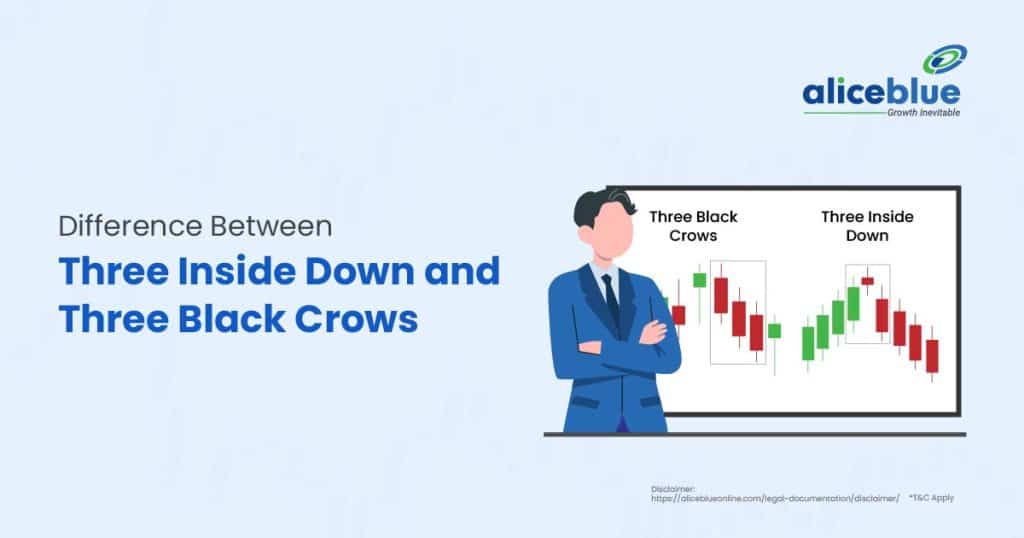
The main difference between Three Inside Down and Three Black Crows is their formation and confirmation of a bearish trend. Three Inside Down signals reversal with a smaller candle inside the first. Three Black Crows shows three consecutive bearish candles, confirming strong selling pressure.
Contents
- Three Inside Down Meaning
- Three Black Crows Meaning
- Difference Between Three Inside Down and Three Black Crows
- Characteristics of Three Inside Down
- Characteristics of Three Black Crows
- How to Identify a Three Inside Down Pattern?
- How to Identify a Three Black Crows Pattern?
- Trading Strategies for Three Inside Down
- Difference Between Three Inside Down and Three Black Crows – Quick Summary
- Three Inside Down vs Three Black Crows – FAQs
Three Inside Down Meaning
Three Inside Down is a bearish reversal pattern that appears after an uptrend. It consists of three candlesticks: a large bullish candle, a smaller bearish candle within the first, and a third bearish candle closing below the first. This pattern signals weakening buying momentum.
The Three Inside Down pattern indicates that buyers are losing strength while sellers gain control. The first candle represents bullish dominance, but the second candle’s smaller body within the first shows hesitation. The third bearish candle confirms selling pressure by closing lower. Traders see this as a sign to exit long positions or consider short trades. A higher trading volume on the third candle strengthens its reliability. It is commonly used in technical analysis to spot early trend reversals.


Three Black Crows Meaning
Three Black Crows is a bearish reversal pattern that signals a strong downtrend. It consists of three consecutive long bearish candles, each opening within previous candle’s body and closing lower. This pattern confirms sustained selling pressure and indicates a shift from bullish to bearish sentiment.
This pattern forms after an uptrend and shows that buyers are losing control. The first bearish candle suggests initial selling, while the second confirms weakness as it closes lower. The third candle strengthens the trend reversal, confirming a shift in market direction. A higher volume during this pattern increases its reliability. Traders use it to identify potential short opportunities and exit long positions. It often appears in overbought conditions, signaling a correction or new downtrend.

Difference Between Three Inside Down and Three Black Crows
The fundamental difference between Three Inside Down and Three Black Crows is their pattern formation. Three Inside Down signals bearish reversal with a three-candle formation that includes an inside bar. Three Black Crows confirm a strong downtrend with three consecutive long bearish candles closing lower.
| Parameter | Three Inside Down | Three Black Crows |
| Formation | Three candles: a bullish candle, a small bearish candle inside the first, and a third bearish candle closing lower. | Three long bearish candles forming consecutively with lower closes. |
| Confirmation | The third candle closing below the first confirms the reversal. | The second and third bearish candles confirm the downtrend. |
| Trend Context | Appears after an uptrend, signaling a possible reversal. | Forms after an uptrend, confirming a strong bearish shift. |
| Strength of Signal | Considered a moderate reversal signal requiring volume confirmation. | A strong and clear bearish signal with high reliability. |
| Market Sentiment | Indicates weakening bullish strength and increasing selling pressure. | Shows strong bearish momentum and aggressive selling. |
| Trading Strategy | Traders may wait for additional confirmation before shorting. | Often used as a direct signal to enter short positions. |
| Reliability | More reliable when accompanied by a high volume on the third candle. | Considered highly reliable, especially when occurring near resistance levels. |
Characteristics of Three Inside Down
The fundamental characteristic of Three Inside Down is its role as a bearish reversal pattern that signals a shift from bullish to bearish momentum. It appears after an uptrend, indicating that buyers are losing strength and sellers are beginning to take control of price movement.
- Three-Candle Formation: This pattern consists of three distinct candles forming consecutively. The first is a bullish candle, showing strong buying interest. The second is a smaller bearish candle that stays within the first, signalling indecision. The third candle is a strong, bearish candle that closes below the first, confirming a reversal.
- Signals a Bearish Reversal: Three Inside Down indicates that the market is losing bullish momentum. The second candle, being smaller and bearish, suggests hesitation from buyers. The third bearish candle shows that sellers have taken control, leading to a price drop. This shift confirms that a potential downtrend may follow.
- Appears After an Uptrend: This pattern forms at the peak of an uptrend. It signals that the upward movement is weakening, and a reversal may occur. Traders look for this pattern at resistance levels or when price action shows exhaustion. Its presence at such points strengthens the reliability of a bearish move.
- Requires Volume Confirmation: Higher trading volume on the third candle strengthens this pattern’s validity. If the third bearish candle closes with high volume, it confirms strong selling pressure. Low volume may indicate weak confirmation, requiring traders to wait for further bearish signals before making trading decisions.
- Market Sentiment Shift: Three Inside Down reflects a change in market sentiment. Buyers dominate initially, but the second candle shows hesitation. The third bearish candle confirms that sellers are gaining control. This transition indicates that traders should reassess their positions, as the trend may no longer favor buyers.
- Used for Trade Exit and Shorting: Traders use this pattern to exit long positions or consider short trades. If it appears near resistance or after a prolonged uptrend, it signals a possible downtrend. Traders often wait for additional confirmation, such as a break below support, before executing short positions.
- More Reliable with Additional Indicators: While Three Inside Down is a strong reversal signal, traders often confirm it with other indicators. Moving averages, RSI, or trendline breaks can add further conviction. If momentum indicators show overbought conditions, the pattern becomes more reliable in predicting a bearish move.
Characteristics of Three Black Crows
The main characteristic of Three Black Crows is its formation of three consecutive bearish candles, each opening within the previous candle’s body and closing lower. It signals strong selling pressure and confirms a bearish reversal, showing that sellers have taken full control after an uptrend.
- Three Consecutive Bearish Candles: This pattern consists of three large bearish candles forming in succession. Each candle opens within the previous candle’s body and closes lower. This formation shows a consistent decline in price, confirming that sellers are dominating the market and pushing prices downward aggressively.
- Indicates Strong Bearish Momentum: Three Black Crows is a powerful bearish pattern because it forms without price retracement. Each candle’s lower close reinforces selling pressure. The absence of significant upward movement suggests that buyers are unable to counter the selling pressure, making this a strong confirmation of a downtrend.
- Appears After an Uptrend: This pattern typically forms at the peak of an uptrend. It signals that buying strength has weakened, and sellers are overpowering the market. Traders look for this pattern when prices reach resistance levels or when other indicators show overbought conditions, increasing its reliability.
- Confirms a Trend Reversal: Three Black Crows provide clear evidence of a market reversal. Unlike patterns that require further confirmation, this pattern itself is strong enough to indicate a shift in direction. When it appears, traders recognize that the bullish phase has ended, and the market is likely to continue downward.
- Market Sentiment Becomes Bearish: This pattern reflects a complete change in sentiment. Buyers initially control the market, but Three Black Crows show a sudden shift to bearish dominance. Traders take this as a sign that selling pressure is increasing, and the likelihood of further price declines is high.
- Used for Short-Selling Strategies: Traders use this pattern as an entry signal for short positions. Since it confirms bearish momentum, it provides a clear opportunity to profit from declining prices. Traders often wait for a slight pullback before entering short trades, reducing the risk of entering at an oversold level.
- More Reliable with Additional Confirmation: Although Three Black Crows is a strong bearish signal, traders often combine it with other indicators. Volume analysis, moving averages, or support level breakdowns can provide extra confirmation. If volume increases during this pattern, it strengthens the bearish case and reduces the chance of a false signal.
How to Identify a Three Inside Down Pattern?
The best way to identify a Three Inside Down pattern is by spotting three specific candlesticks after an uptrend. The first is a large bullish candle, followed by a smaller bearish candle inside the first. The third bearish candle closes below the first, confirming a potential reversal.
- Formation of Three Candles: This pattern consists of three consecutive candles. The first is a strong bullish candle that reflects buyer dominance. The second is a smaller bearish candle that remains within the first, showing hesitation. The third bearish candle closes lower, confirming that sellers have gained control and a reversal is underway.
- Occurs After an Uptrend: This pattern forms at the peak of an uptrend. It signals that the market is struggling to push higher. The appearance of a bearish structure after a strong rally suggests that buyers are losing momentum. This makes the Three Inside Down pattern an early sign of a possible trend reversal.
- Second Candle Stays Within the First: The second candle must be bearish and fit entirely within the first bullish candle. This indicates indecision in the market. Buyers try to continue the uptrend, but their failure to extend the rally suggests a weakening trend. This candle plays a key role in confirming a shift in sentiment.
- Third Candle Closes Below the First: The final bearish candle is the most important. It must close below the low of the first bullish candle. This confirms that sellers are now in control. If the third candle fails to close lower, the pattern is incomplete, and the reversal signal becomes weak.
- Volume Confirmation Strengthens the Pattern: A strong Three Inside Down pattern often has increasing volume on the third candle. This indicates that sellers are more aggressive. Higher volume confirms the validity of the bearish reversal. If volume remains low, traders may wait for further confirmation before taking action.
- Appears Near Resistance Levels: This pattern is more effective when it forms near key resistance levels. Resistance zones already indicate selling pressure. When the Three Inside Down pattern appears in such areas, it suggests that the uptrend is exhausting, making the chances of a reversal higher.
- Works Best with Additional Indicators: Traders use moving averages, RSI, or trendline analysis to confirm this pattern. If RSI shows overbought conditions or a key moving average breaks down, the reversal becomes more reliable. Combining this pattern with other indicators improves accuracy and reduces false signals.
How to Identify a Three Black Crows Pattern?
The ideal way to identify a Three Black Crows pattern is by spotting three consecutive bearish candles after an uptrend. Each candle opens within the previous candle’s body and closes lower. This formation confirms strong selling pressure and signals a possible trend reversal.
- Three Consecutive Bearish Candles: This pattern consists of three large red candles forming in sequence. Each candle opens within the previous one’s body and closes lower. The continuous decline in price confirms that sellers are dominating the market. It indicates a shift in momentum from bullish to bearish.
- Appears After an Uptrend: This pattern forms at the end of a bullish trend. It signals that the market is losing upward momentum. When buyers fail to push prices higher, and sellers take control, the pattern emerges. Traders watch for this signal to confirm a bearish shift in market direction.
- No Significant Price Retracement: A key feature of Three Black Crows is that each bearish candle forms without a strong upward retracement. The lack of temporary rebounds between candles indicates strong selling pressure. When this pattern develops with minimal pullbacks, it confirms that sellers are firmly in control.
- Lower Highs and Lower Lows in Candles: Each of the three candles must form a lower high and a lower low compared to the previous one. This confirms the strength of the bearish momentum. If any of the candles fail to form a lower low, the pattern becomes weak and requires further confirmation.
- Increasing Volume Confirms Strength: A strong Three Black Crows pattern often appears with rising volume. Higher volume during the formation confirms strong selling interest. If volume is low, the pattern may not be as reliable. Traders often wait for volume confirmation before making trading decisions.
- Formation Near Key Resistance Increases Reliability: This pattern is more effective when it appears near a major resistance level. A resistance level already suggests strong selling interest. When Three Black Crows form in such areas, it increases the probability of a successful bearish reversal. Traders consider this a stronger signal.
- Best Confirmed with Technical Indicators: While the pattern itself is strong, traders use additional indicators for confirmation. Moving averages, RSI, and MACD help validate the trend shift. If RSI shows overbought conditions or MACD crosses downward, the reversal signal becomes more reliable, reducing the chances of a false move.
Trading Strategies for Three Inside Down
The best trading strategies for Three Inside Down focus on confirming the pattern and executing trades based on strong bearish signals. This pattern signals a reversal after an uptrend, so traders look for additional confirmation before entering short positions or exiting long trades.
- Wait for Confirmation with a Strong Close: The third candle must close below the first candle’s low to confirm the pattern. A weak close or indecisive movement may indicate a false signal. Traders often wait for the next candle to open lower or for additional bearish movement before taking action.
- Use Volume Analysis for Strength: A strong Three Inside Down pattern is often accompanied by increasing volume on the third candle. High volume indicates strong selling pressure, making the reversal more reliable. If volume is low, traders may wait for further price action before committing to a trade.
- Identify Key Resistance Levels: This pattern is more effective when it forms near a strong resistance level. Resistance levels indicate selling pressure, and the Three Inside Down pattern reinforces this weakness. Traders often use this pattern to confirm a failed breakout before entering a short position.
- Set Stop-Loss Above the First Candle: Risk management is crucial when trading this pattern. Traders typically place a stop-loss above the high of the first bullish candle. This prevents excessive losses if the pattern fails. A close above this level invalidates the pattern and signals potential upward movement.
- Enter Short Position After Breakdown: Traders wait for price action to confirm the reversal before entering a short trade. A breakdown below the third candle’s low strengthens the signal. Some traders enter on the close of the third candle, while others wait for further downside movement for extra confirmation.
- Combine with Moving Averages for Accuracy: Moving averages help confirm the trend reversal. If the price falls below a key moving average after the pattern forms, it strengthens the bearish signal. A declining 50-day or 200-day moving average further supports the downtrend, increasing the trade’s probability of success.
- Monitor Market Conditions Before Trading: Broader market conditions affect the reliability of this pattern. If the overall market is bullish, the reversal may be weaker. In a bearish or neutral market, Three Inside Down is more effective. Traders analyze market sentiment before making trading decisions.
Difference Between Three Inside Down and Three Black Crows – Quick Summary
- The main difference between Three Inside Down and Three Black Crows is their formation and confirmation. Three Inside Down signals a potential reversal with an inside candle, while Three Black Crows confirms strong bearish momentum with three consecutive bearish candles closing lower.
- Three Inside Down is a bearish reversal pattern that appears after an uptrend. It consists of a large bullish candle, a smaller bearish candle inside the first, and a third bearish candle closing lower, confirming the shift in trend.
- Three Black Crows is a strong bearish pattern that signals the beginning of a downtrend. It consists of three consecutive bearish candles, each opening within the previous candle’s body and closing lower, indicating sustained selling pressure.
- The key difference between Three Inside Down and Three Black Crows lies in their structure and reliability. Three Inside Down suggests a reversal, while Three Black Crows confirms a clear shift in market sentiment. The latter is considered a stronger and more reliable bearish signal.
- The primary characteristic of Three Inside Down is its three-candle structure, where the second candle remains inside the first, showing indecision. The third bearish candle confirms the trend reversal, indicating that sellers have taken control.
- The main characteristic of Three Black Crows is its formation of three consecutive bearish candles. Each candle opens within the previous one’s body and closes lower, confirming strong selling momentum and signaling the continuation of a bearish trend.
- The best way to identify Three Inside Down is by spotting three specific candlesticks after an uptrend. The first is a large bullish candle, the second is a smaller bearish candle within the first, and the third is a bearish candle closing below the first, confirming the reversal.
- The ideal way to identify Three Black Crows is by looking for three consecutive bearish candles after an uptrend. Each candle should open within the previous candle’s body and close lower, showing a clear shift from bullish to bearish sentiment.
- The best trading strategies for Three Inside Down involve waiting for confirmation before entering a trade. Traders look for volume increase, resistance levels, and additional technical indicators to confirm the pattern before shorting or exiting long positions.
- Effective trading strategies for Three Black Crows focus on entering short trades after confirmation. Traders monitor price action, use stop-loss strategies, and rely on moving averages or momentum indicators to strengthen the bearish signal before taking positions.
- Detect bearish reversals like Three Inside Down and Three Black Crows with precision. Alice Blue Online provides clear charts and real-time market updates to help you make confident trading decisions. Register now to begin smart trading.

Three Inside Down vs Three Black Crows – FAQs
1. What Is The Difference Between Three Inside Down and Three Black Crows?
Three Inside Down signals a bearish reversal with an inside candle formation, while Three Black Crows confirms a strong downtrend with three consecutive bearish candles closing lower, showing stronger selling pressure.
2. What Is Three Inside Down?
Three Inside Down is a bearish reversal pattern forming after an uptrend. It consists of a bullish candle, a smaller bearish candle inside the first, and a third bearish candle closing lower, confirming selling pressure.
3. What Is Three Black Crows?
Three Black Crows is a bearish candlestick pattern that confirms a downtrend. It consists of three consecutive bearish candles, each opening within the previous candle’s body and closing lower, indicating sustained selling momentum.
4. Is The Three Inside Down Pattern Reliable?
Three Inside Down is a moderately reliable bearish reversal pattern. Its reliability increases when supported by high volume, resistance levels, or additional technical indicators confirming a weakening uptrend and growing selling pressure.
5. What Happens After A Three Inside Down Pattern?
After a Three Inside Down pattern, prices typically decline as sellers take control. A confirmed downtrend often follows, but traders watch volume and market conditions for additional confirmation before entering short positions.
6. What Happens After A Three Black Crows Pattern?
After a Three Black Crows pattern, the market usually experiences further decline. The pattern confirms strong bearish momentum, leading to continued selling pressure and potential trend reversal, especially if volume supports the move.
7. Is Three Black Crows A Stronger Signal Than Three Inside Down?
Yes, Three Black Crows is a stronger bearish signal than Three Inside Down. It shows consistent selling pressure over three consecutive sessions, making it a more reliable indication of a confirmed downtrend.
8. What Does A Three Inside Down Pattern Indicate?
Three Inside Down indicates a bearish reversal after an uptrend. It shows that buying momentum is weakening, and sellers are gaining control, increasing the probability of a downward price movement.
9. What Is The Opposite Of The Three Black Crows Pattern?
The opposite of Three Black Crows is Three White Soldiers. It is a bullish reversal pattern consisting of three consecutive bullish candles, each closing higher, confirming strong buying pressure after a downtrend.
10. What Does A Three Black Crows Pattern Indicate?
Three Black Crows indicate strong selling pressure and a confirmed bearish reversal. It shows that sellers have taken control, weakening bullish momentum and increasing the likelihood of continued downward movement in price.





