
Support is a price level where a stock historically stops falling due to concentrated buying interest, while resistance is a price level where rising prices halt due to heavy selling pressure. Together, these structural zones form the foundation for technical chart analysis.
Note: “Support and Resistance” and “Supply and Demand” are closely related but are not the same concept.
To build a reliable framework for support and resistance trading for Indian Stock Market strategies, you must understand market psychology. Prices move because of the constant tug-of-war between buyers (demand) and sellers (supply).
1. When prices drop to a specific floor, buyers view the asset as undervalued and step in heavily, creating a support level.
2. Conversely, when prices climb to a specific ceiling, sellers and short-sellers view the asset as overvalued and dump their positions, creating a resistance level.
Let’s see this in the Nifty 50 Chart now (updated on July 16, 2026):
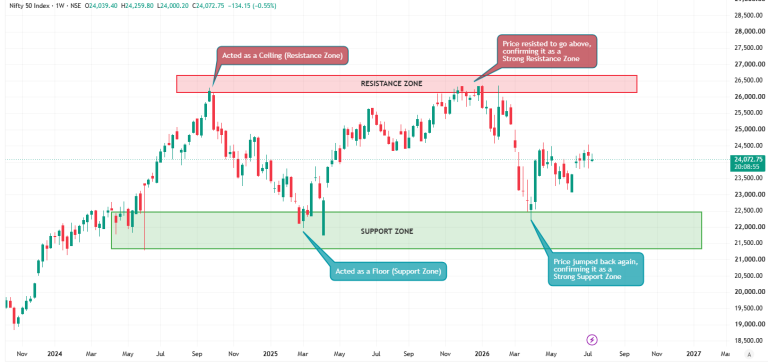
In the above example, we look at the chart data in TradingView for Nifty 50 between November of 2023 and today, mid of July 2026, clearly seeing the Support and Resistance Zone, as per today’s market.
Rather than treating these boundaries as exact single-rupee lines, experienced market participants view them as flexible fields or supply and demand zones.
In practical application, identifying and executing trades around structural price areas follows a strict, logical sequence to filter out market noise.
Open a daily (1D) or 1-hour (1H) chart of your selected stock or index. Locate the macro swing highs and swing lows where the price reversed sharply in the recent past.
2 . Refine Levels on Lower Timeframes: Zoom In for Intraday Strategy.
Drop down to a 15-minute chart to identify local intraday support and resistance levels. Adjust your macro lines into narrow price bands or zones to account for recent wick rejections.
3. Wait for Candlestick Validation: Filter Out Fake Signals.
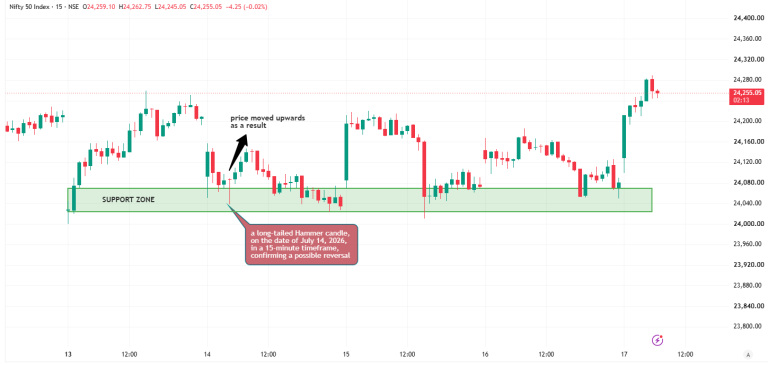
Allow the price to trade directly into your marked zone. Wait for a confirmation pattern, such as a long-tailed Hammer candle at support or a Shooting Star at resistance.
4 . Execute with Pre-Defined Parameters: Risk Optimisation.
Enter your trade immediately after the confirmation candle closes. Place a stop-loss slightly outside the opposite edge of the zone to protect your capital if the structure breaks.
In the example below, we look at the Nifty 50 chart between July 13, 2026 and July 17, 2026, and try to spot an intraday price reversal upon support and a long-tailed hammer candle.
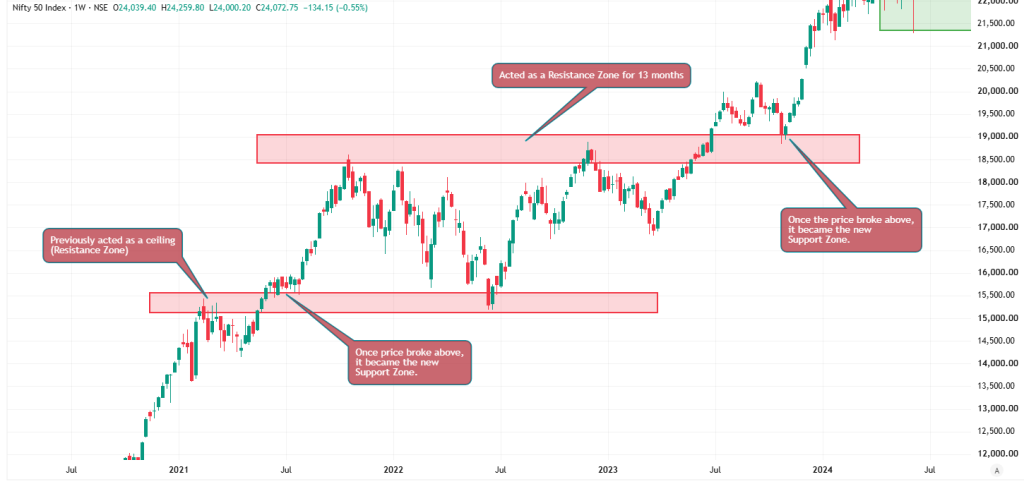
We can use the example chart from above on how to find support and resistance in Nifty charts during an active market session:
When building an intraday support and resistance trading strategy, traders rely on two main types of structural overlays:
Feature | Horizontal Support & Resistance | Dynamic Support & Resistance |
Price Structure | Remains fixed at a permanent price coordinate. | Shifts continuously with every new candle print. |
Primary Tools | Manual trendlines, historical swing points, Pivot points. | Moving Averages (e.g., 50 EMA, 200 EMA), Bollinger Bands. |
Best Market Condition | Highly effective in sideways, range-bound, or consolidating markets. | Highly effective in fast-moving, aggressive trending environments. |
Drawing lines on a chart is only half the battle. To filter out false breakouts and “traps,” smart traders use these five technical indicators to confirm whether a support or resistance zone will actually hold.
Horizontal levels are only as strong as the institutional money defending them.
VWAP is a vital intraday benchmark used heavily by institutional algorithms in the Indian market.
The RSI is a momentum oscillator that helps you spot when a price move near a key level is running out of steam.
Moving averages act as dynamic, continuous floors and ceilings that automatically adjust with every new price print.
Pivot Points are mathematical price coordinates automatically calculated using the previous session’s high, low, and close.
We discuss 4 out of these 5 above topics in detail with charts in 7 Best Indicators for Swing Trading.
Mastering structural chart zones is one of the most reliable ways to build a consistent trading approach. By grounding your execution in historical price behaviour rather than speculative guesswork, you treat the market as a process based on probabilities.
Keep your chart layouts clean, wait patiently for price validation at your pre-marked zones, and treat your stop-loss as an absolute insurance policy. Consistently applying these structural principles transforms trading from an emotional gamble into a more disciplined approach.
The best support and resistance indicator for NSE intraday tracking is standard Pivot Points (specifically Camarilla or Fibonacci variations) combined with the Anchored VWAP. These tools automatically compute high-probability daily target fields based on volume and structural volatility.
Look for zones that have triggered sharp, high-volume price reversals at least twice on higher timeframes like the 1-hour or daily charts. The more severe the historical rejection away from a level, the stronger that zone is considered.
This is known as a structural role reversal. When the price breaks cleanly below a support floor, that level changes into a new resistance ceiling because trapped buyers are eager to sell their positions to break even when the price rallies back up to it.
You should always map your structural support and resistance zones on the Nifty Spot chart. Spot charts represent the actual intrinsic value of the underlying index without the variable premium or discount distortions that affect futures contracts. Once you identify a clear validation signal on the Spot layout, you can execute your position using the corresponding Futures or Options contract.
A support floor actually gets weaker after multiple rapid tests within a short period. Every time the price bounces off a support level, it absorbs a portion of the institutional buy orders resting at that zone. Think of it like a hammer striking a wall, by the third or fourth consecutive hit, the buy orders are depleted, and the price is highly likely to break straight through.
When an asset opens with a significant gap, it immediately alters the intraday market structure. If a stock gaps down completely below a key support zone, that floor instantly flips to become a strong resistance ceiling. Instead of rushing to trade right at 9:15 AM, let the market print its initial 15-minute range to see if the price treats the old support zone as a new barrier before entering a short position.
Support and resistance configurations are drastically more reliable on NSE-listed equities due to higher trading volumes and deeper order-book liquidity. Illiquid stocks or counters exclusively traded on the BSE are prone to high slippage and irregular price wicks, which frequently pierce technical zones without any true structural changes.
Corporate updates mechanically lower the nominal share price of a stock, which will completely misalign your historical manual drawings. To fix this, open your charting software preferences and ensure that “Adjust for Corporate Actions” (or Adjust for Dividends) is actively toggled on. This normalises all historical price points so your calculated supply and demand areas stay perfectly accurate.
Attention Investors!
Stock Brokers can accept securities as margin from clients only by way of pledge in the depository system w.e.f. September 1, 2020. Update your mobile number & email Id with your stock broker/depository participant and receive OTP directly from the depository on your email id and/or mobile number to create a pledge. Pay 20% upfront margin of the transaction early to trade in the cash market segment. Investors may please refer to the Exchange’s Frequently Asked Questions (FAQs) issued vide circular reference NSE/INSP/45191 dated July 31, 2020, and NSE/INSP/45534 dated August 31, 2020, and other guidelines issued from time to time in this regard. Check your Securities /MF/ Bonds in the consolidated account statement issued by NSDL/CDSL every month.
Corporate Office: No. 153/2, 3rd Floor, M.R.B.Arcade, Bagalur Main Road, Dwaraka Nagar, Yelahanka, Bengaluru – 560 063, Karnataka.
Registered Office: Old No.56/2 ,New No.58, LIC Nagar, Vinayagar Kovil Street, Erode -8,Tamil Nadu– 638002.
Alice Blue Financial Services (P) Ltd : NSE EQ | NSE FO | NSE CDS-90112 SEBI REG : INZ000156038
Alice Blue Financial Services (P) Ltd : BSE EQ | BSE FO | BSE CD-6670 SEBI REG : INZ000156038
Alice Blue Financial Services (P) Ltd : CDSL DP ID 12085300 DP SEBI REG : IN-DP-364-2018
Alice Blue Financial Services (P) Ltd : MCX-56710 SEBI REG : INZ000156038
We hereby declare that we are doing PRO trading
Procedure to file a complaint on SEBI SCORES : Register on SEBI SCORES 2.0. Mandatory details for filing complaints on SCORES: Name, PAN, Address, Mobile Number, E-mail ID. Benefits: Effective Communication, Speedy redressal of the grievances
Click on the provided link to learn about the process for submitting a complaint on the ODR platform for resolving investor grievances.
Investment in securities markets are subject to market risks, read all the related documents carefully before investing. Brokerage will not exceed SEBI prescribed limit.
For queries regarding account opening or activation, email to [email protected] and for fund updates, email to [email protected]
Disclaimer : Prevent unauthorized transactions in your account. Update your mobile numbers/email IDs with your stock brokers. Receive information of your transactions directly from Exchange on your mobile/email at the end of the day. Issued in the interest of investors. All clients have to update their email id and mobile number with Member : Investor Grievance [email protected]
KYC is a one time exercise while dealing in securities markets – once KYC is done through a SEBI registered intermediary (broker, DP, Mutual Fund etc.), you need not undergo the same process again when you approach another intermediary.
No need to issue cheques by investors while subscribing to an IPO. Just write the bank account number and sign in the application form to authorise your bank to make payment in case of allotment. No worries for refund as the money remains in the investor’s account.
Investors are requested to note that Alice Blue Financial Services Private Limited is permitted to receive money from investor through designated bank accounts only named as Up streaming Client Nodal Bank Account (USCNBA). Alice Blue Financial Services Private Limited is also required to disclose these USCNB accounts to Stock Exchange. Hence, you are requested to use following USCNB accounts only for the purpose of dealings in your trading account with us. The details of these USCNB accounts are also displayed by Stock Exchanges on their website under “Know/ Locate your Stock Broker. Bank Details (Valid UPI FAQ).


