
It’s 9:45 AM on a Tuesday, you’re staring at your portfolio, Reliance stock has been climbing steadily for two weeks, and you’re up 18%, and then, in a single red candle, it drops 4% in 20 minutes, and you enter panic mode and sell everything at the bottom, and the very next day it bounces back up 7%, and your emotion cost you ₹47,000 in losses.
If this has happened to you, you aren’t alone; lakhs of retail traders lose money exactly like this every month, and the market doesn’t care about your feelings. But there is a useful tool that could have saved you from panic selling and given you an estimate of where exactly to book a profit or buy the dip.
In this complete 2026 guide, we’ll explain what RSI is, how it’s calculated, how to read it like an expert, and five strategies that work in Indian market conditions and exact mistakes 90% of traders still make today.
The Relative Strength Index, or RSI, is a momentum oscillator that measures the speed and change of price movements on a scale of 0 to 100.
It was created by J. Welles Wilder Jr. in 1978 and first appeared in his book New Concepts in Technical Trading Systems.
Important Note: RSI does not compare a stock’s strength against other stocks or the broader market; it just compares the stock’s own recent gains versus its recent losses, which is why it’s called “Relative Strength”.
Default setting: 14 periods (the one Wilder recommended and almost everyone uses in India).
Formula:
Where:
RS (Relative Strength) = Average Gain / Average Loss over the chosen 14 periods.
Step-by-step:
On the very first calculation, it uses simple averages. After that, it switches to Wilder’s smoothing method (which all charting software uses).
Tip: On intraday charts, many Indian traders switch to 9-period or 7-period RSI for faster signals. Daily charts almost always stick to 14.
RSI Level | Market Condition | Typical Action in India |
Above 70 | Overbought | Potential sell or booking profits |
50-70 | Bullish momentum | Stay long or look for dips to buy |
40-50 | Neutral / Weakening | Caution: watch for reversal |
Below 30 | Oversold | Potential buy or covering shorts |
Nifty 50 Example:
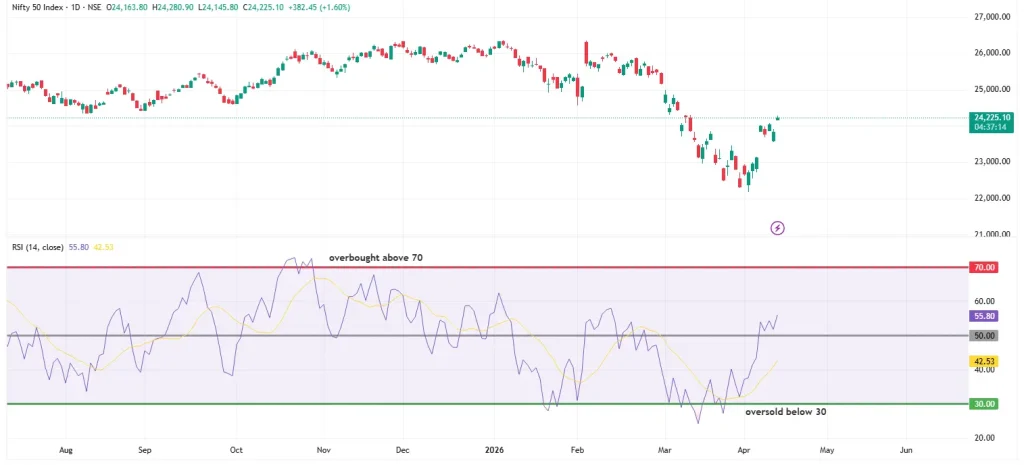
Picture above: Shows the current Nifty 50 chart, where we see the price went below the oversold region in March-April of 2026 and bounced back as a direct result. The price was overbought around late October of 2025, followed by a pullback as a direct result.
Key nuances for Indian markets:
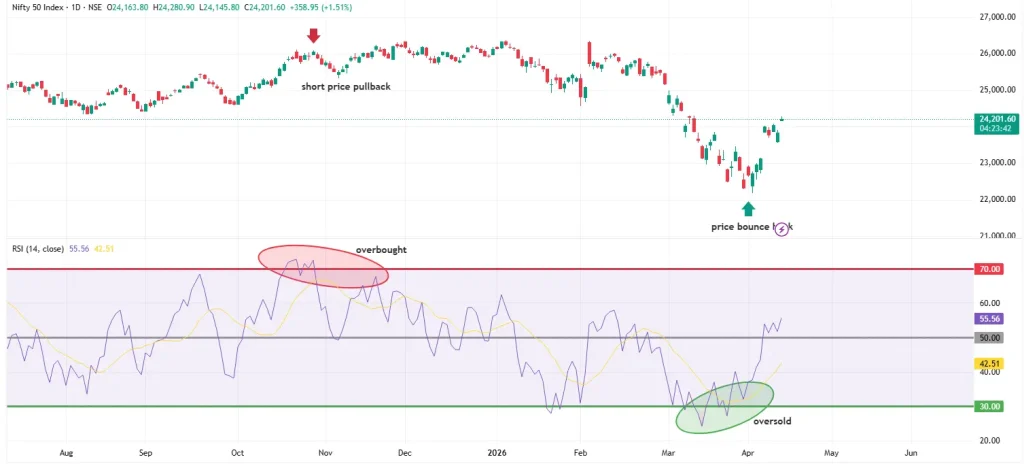
This is the single most powerful RSI signal in Indian markets.
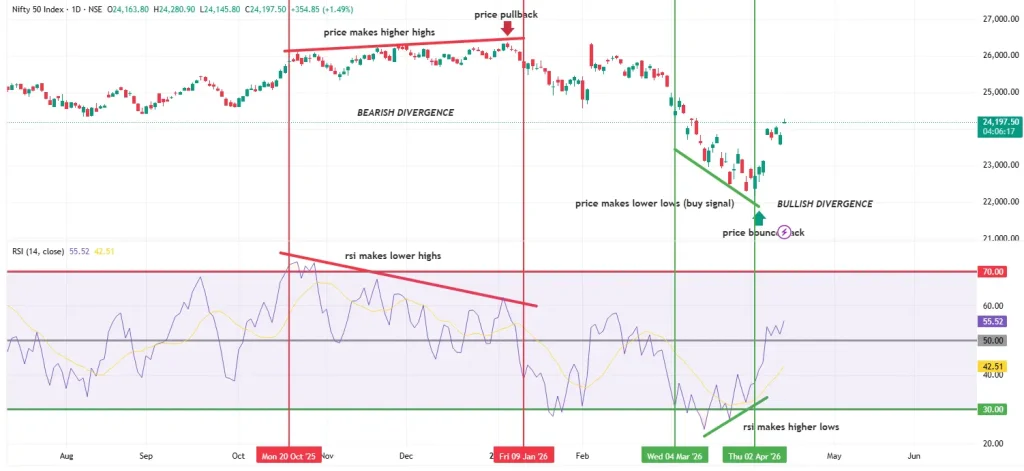
Divergence works especially well on Bank Nifty and mid-cap stocks during earnings season.
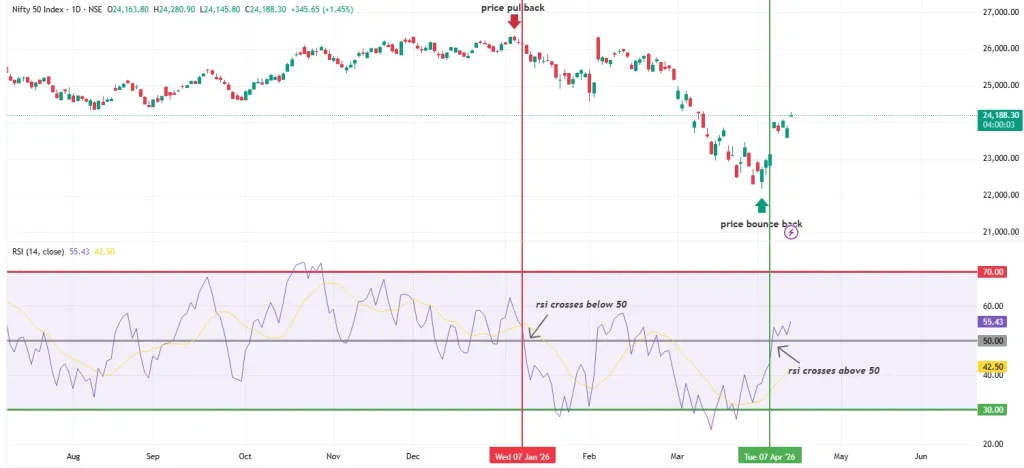
Combine with a 200-day EMA for trend confirmation.
Best Indian setup in 2026:
RSI (14) + 50 & 200 EMA + Volume + Support/Resistance.
Example: When RSI crosses above 50, price is above 50 EMA, and volume is rising → high probability for upside movement.
Additional Resources:
Intraday (5-min or 15-min charts):
Positional / Swing (Daily Charts):
Tip: Banking and auto stocks respect RSI levels more than IT stocks (which can stay overbought longer).
TradingView is the best in class for both advanced and custom traders, providing free and paid plans, but if you were to sign up on AliceBlue, you’d get access to all premium features on TradingView because of the tie-up.
How to add RSI on TradingView:
RSI is still one of the most powerful tools available to Indian traders in 2026, which will help you avoid making those emotional ₹40,000 mistakes.
To implement these RSI strategies effectively, many traders use professional charting platforms to monitor real-time data. Through a partnership with Alice Blue, traders can access TradingView’s full suite of technical tools, including customised RSI settings, multi-timeframe analysis, and divergence alerts, directly within their trading interface.
For those looking to streamline their workflow, opening a Demat account with a discount broker like Alice Blue allows you to monitor advanced TradingView RSI charts and execute trades from a single, integrated platform.
RSI is primarily a short-to-medium-term momentum tool, but can be used on weekly or monthly charts to spot major trend reversals for positional or long-term investors. For pure buy-and-hold investing, combine it with fundamental analysis rather than relying on it alone.
Both are momentum oscillators, but RSI measures the strength of recent gains versus losses over 14 periods, while Stochastic compares the closing price to the recent
RSI works on any price-based chart, Nifty 50, Bank Nifty, sectoral indices, ETFs, commodity futures on MCX, or even mutual fund NAV charts, and the same rules and strategies apply to them.
Attention Investors!
Stock Brokers can accept securities as margin from clients only by way of pledge in the depository system w.e.f. September 1, 2020. Update your mobile number & email Id with your stock broker/depository participant and receive OTP directly from the depository on your email id and/or mobile number to create a pledge. Pay 20% upfront margin of the transaction early to trade in the cash market segment. Investors may please refer to the Exchange’s Frequently Asked Questions (FAQs) issued vide circular reference NSE/INSP/45191 dated July 31, 2020, and NSE/INSP/45534 dated August 31, 2020, and other guidelines issued from time to time in this regard. Check your Securities /MF/ Bonds in the consolidated account statement issued by NSDL/CDSL every month.
Corporate Office: No. 153/2, 3rd Floor, M.R.B.Arcade, Bagalur Main Road, Dwaraka Nagar, Yelahanka, Bengaluru – 560 063, Karnataka.
Registered Office: Old No.56/2 ,New No.58, LIC Nagar, Vinayagar Kovil Street, Erode -8,Tamil Nadu– 638002.
Alice Blue Financial Services (P) Ltd : NSE EQ | NSE FO | NSE CDS-90112 SEBI REG : INZ000156038
Alice Blue Financial Services (P) Ltd : BSE EQ | BSE FO | BSE CD-6670 SEBI REG : INZ000156038
Alice Blue Financial Services (P) Ltd : CDSL DP ID 12085300 DP SEBI REG : IN-DP-364-2018
Alice Blue Financial Services (P) Ltd : MCX-56710 SEBI REG : INZ000156038
We hereby declare that we are doing PRO trading
Procedure to file a complaint on SEBI SCORES : Register on SEBI SCORES 2.0. Mandatory details for filing complaints on SCORES: Name, PAN, Address, Mobile Number, E-mail ID. Benefits: Effective Communication, Speedy redressal of the grievances
Click on the provided link to learn about the process for submitting a complaint on the ODR platform for resolving investor grievances.
Investment in securities markets are subject to market risks, read all the related documents carefully before investing. Brokerage will not exceed SEBI prescribed limit.
For queries regarding account opening or activation, email to [email protected] and for fund updates, email to [email protected]
Disclaimer : Prevent unauthorized transactions in your account. Update your mobile numbers/email IDs with your stock brokers. Receive information of your transactions directly from Exchange on your mobile/email at the end of the day. Issued in the interest of investors. All clients have to update their email id and mobile number with Member : Investor Grievance [email protected]
KYC is a one time exercise while dealing in securities markets – once KYC is done through a SEBI registered intermediary (broker, DP, Mutual Fund etc.), you need not undergo the same process again when you approach another intermediary.
No need to issue cheques by investors while subscribing to an IPO. Just write the bank account number and sign in the application form to authorise your bank to make payment in case of allotment. No worries for refund as the money remains in the investor’s account.
Investors are requested to note that Alice Blue Financial Services Private Limited is permitted to receive money from investor through designated bank accounts only named as Up streaming Client Nodal Bank Account (USCNBA). Alice Blue Financial Services Private Limited is also required to disclose these USCNB accounts to Stock Exchange. Hence, you are requested to use following USCNB accounts only for the purpose of dealings in your trading account with us. The details of these USCNB accounts are also displayed by Stock Exchanges on their website under “Know/ Locate your Stock Broker. Bank Details (Valid UPI FAQ).


