
Picture this. You bought a Nifty call option two days before the Union Budget. You called the direction right. Nifty moved up on Budget day. Your option barely moved. The reason was simple: you never checked the breakeven price before entering. You needed Nifty to rise by 300 points just to recover the premium you paid. The market gave you 200.
This situation plays out in Indian options markets every week. A payoff diagram, also called an options P&L chart or options risk graph, shows you the exact breakeven, maximum loss, and maximum profit of any options strategy before you place the trade. If you are new to options, start with What Is Options Trading and Difference Between Futures and Options before continuing here.
A payoff diagram is a graph that shows your profit or loss across every possible price of the underlying asset at expiry. The horizontal axis shows price levels of the underlying, such as the Nifty 50. The vertical axis shows the rupee profit or loss your position generates at each price.
The line running across the chart is your payoff line. Every point on it answers one question: if Nifty closes at this price on expiry day, how much do I make or lose?
Three reference points on every option’s risk graph matter:
A standard payoff diagram shows results at expiry only. It does not show what happens to your trade value on day three of a fifteen-day position. For that, you need the current day P&L line available on platforms like Alice Blue, ANT and Sensibull.
Open the strategy builder on Alice Blue ANT, and you will see two lines on the chart.
The solid line shows your profit or loss at expiry, assuming you hold the position until the last day of the contract.
The dotted line shows your current day P&L based on today’s option premiums and current implied volatility.
Most Indian options traders who exit early and take unnecessary losses do so because they track the solid expiry line mentally while their actual position tracks the dotted current-day line. If you are exiting a trade in five days, the dotted line is what matters. The solid line becomes relevant only if you hold until expiry.
To understand why implied volatility affects the dotted line so much, read Theta in Options Trading: Time Decay Explained.
Step 1: Identify the price range on the horizontal axis.
If Nifty is at 22,000, the chart typically spans from 20,000 to 24,000 with the current price near the centre.
Step 2: Find the breakeven point.
For a long call on Nifty 22,000 CE bought at 150 premium, the breakeven is 22,150. Formula: Strike Price + Premium Paid = Breakeven.
Step 3: Check the maximum downside.
For the options you buy, find the flat section on the left side of the diagram. That flat level equals the total premium paid. For a 150 rupee premium on a lot of 65 units (current Nifty lot size as of January 2026), the maximum loss is 9,750 rupees, no matter what Nifty does.
Step 4: Check the maximum upside.
For a plain long call, the payoff line rises indefinitely to the right. For spread strategies, the line flattens at a capped profit level. That ceiling is the maximum you can make from the trade, locked in before you enter.
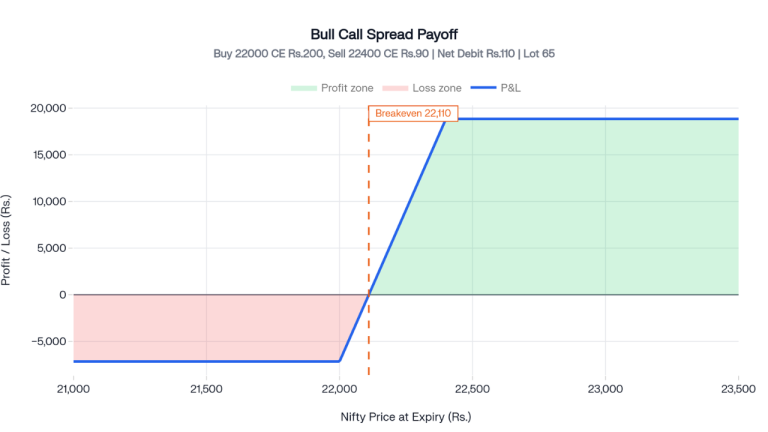
Nifty is trading at 22,000. You expect a moderate rise before the monthly expiry. A plain long call costs too much. You set up a Bull Call Spread:
Formula verification:
Nifty Price at Expiry | Outcome | P&L |
Below 22,000 | Both calls expire worthless | Rs. 7,150 loss (maximum loss) |
22,110 | 22,000 CE has 110 intrinsic value | Rs. 0 (breakeven) |
22,250 | 22,000 CE is worth 250, net gain 140 per unit | Rs. 9,100 profit |
22,400 and above | Maximum spread value reached | Rs. 18,850 profit (maximum profit) |
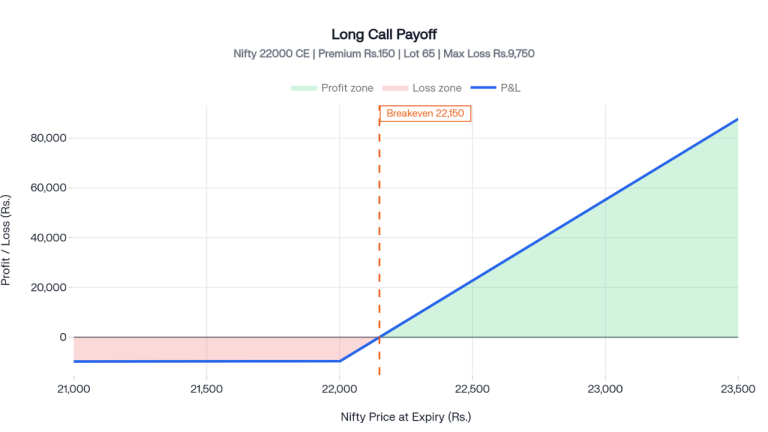
The flat section on the left shows the maximum loss limited to the premium paid. The line rises steeply to the right once Nifty crosses the strike. Maximum profit is theoretically unlimited.
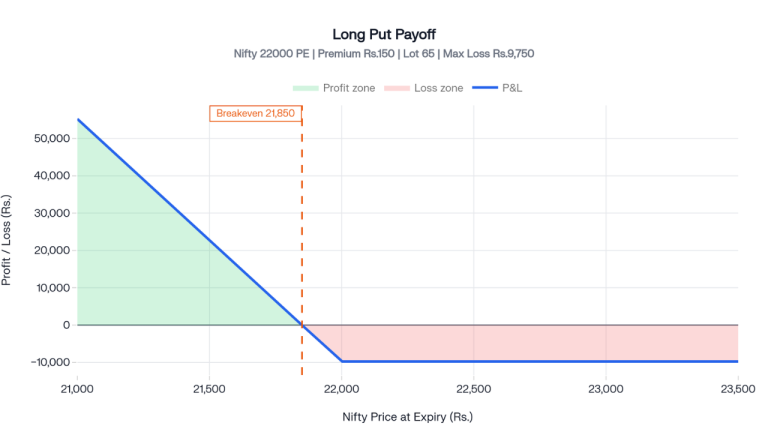
Rises to the left as the underlying falls below the strike. Flat on the right at the premium paid level. Maximum loss is limited to the premium paid. Maximum profit grows as Nifty falls toward zero.
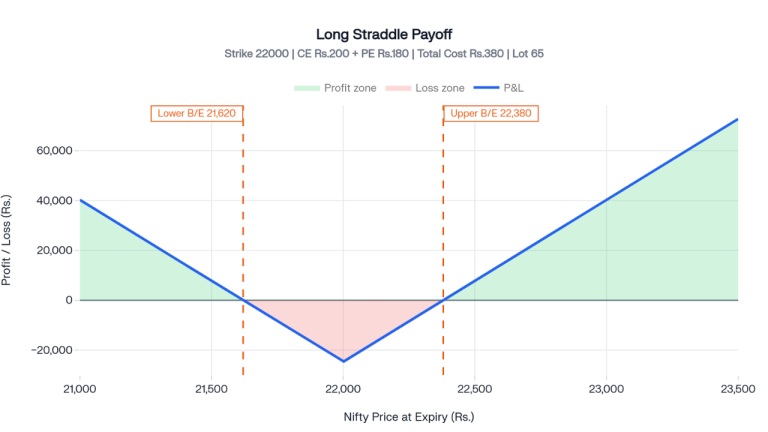
You buy both a call and a put at the same strike. The diagram forms a V shape with two breakeven points:
If Nifty stays between both breakeven points at expiry, you lose the combined premium. If Nifty breaks out sharply in either direction beyond either breakeven, the trade becomes profitable. Read the full strategy guide: Mastering Long Straddle Options Strategy.
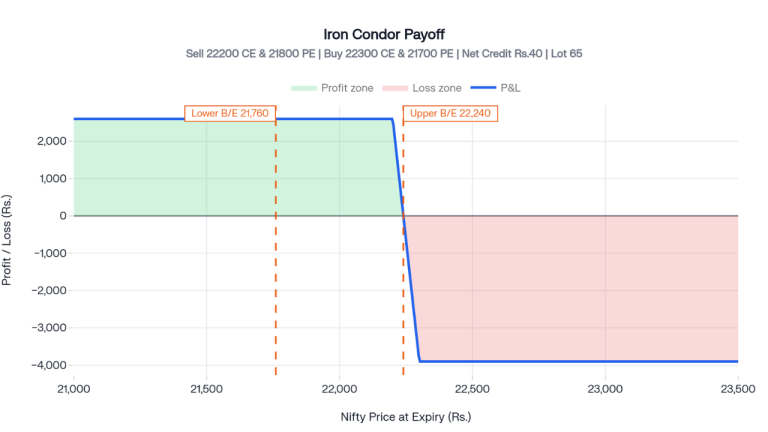
A four-leg strategy is used when you expect Nifty to stay within a range. You sell an out-of-the-money call and an out-of-the-money put while buying further out-of-the-money options on both sides as protection.
Example with Nifty at 22,000:
For traders who want to go further, How to Build a Consistent Options Trading System and F&O Trading Psychology are useful next reads.
Feature | Payoff Diagram | P&L Chart |
What it measures | Intrinsic value of the option at expiry | Net profit or loss after deducting the premium paid |
Zero reference line | Set at the strike price | Set at the breakeven point |
Includes premium paid | No | Yes |
Better suited for | Understanding option theory | Making real trading decisions |
For every real trading decision, use the P&L chart. It shows what actually lands in your account.
To understand how to hedge your portfolio using these strategies, see How to Hedge Your Stock Portfolio Using F&O in India.
Suited for:
For a broader picture of where options fit against equity investing, read F&O vs Equity Delivery for Long Term Wealth.
Less relevant for:
Most options traders who lose money on technically correct directional calls do so because they never checked the breakeven before entering. The payoff diagram fixes this. It shows maximum loss, breakeven price, and profit zone at a glance before capital is committed. Open the Alice Blue ANT strategy builder, add your trade legs, look at the chart, and then place the order. Also explore
Diagonal Spread Options in India and Max Pain in Options for more advanced reading, once you are comfortable with payoff diagrams.
To start trading options with zero brokerage on equity delivery, Open Your Free Alice Blue Account Here.
A payoff chart shows profit or loss at every possible price of Nifty or a stock at expiry. The horizontal axis shows price levels, and the vertical axis shows rupee profit or loss. It gives you the full risk-and-reward picture of a trade before you place it.
For a long call, the formula is Strike Price + Premium Paid = Breakeven. If you buy a Nifty 22,000 CE at 150 rupees, the breakeven is 22,150. On the payoff chart, this is where the payoff line crosses the zero line.
The dotted line shows your current day P&L based on today’s option premiums and implied volatility. The solid line shows the outcome if you hold until expiry. For trades you plan to exit early, track the dotted line, not the solid one.
No. The standard expiry payoff diagram shows the outcome on expiry day only. It does not show how time decay reduces position value daily. To track theta impact, use the current day P&L line on Alice Blue ANT or Sensibull.
A V shape represents a long straddle or long strangle. You profit if the underlying makes a large move in either direction. If the price stays flat near the strike at expiry, you lose the total premium paid.
Open the Strategy Builder in ANT Web or the app, select your underlying, add your option legs with strike, expiry, and quantity, and the platform generates the payoff chart automatically with breakeven, maximum profit, and maximum loss displayed below the chart.
Yes. Strategies like bull call spreads cap the maximum profit but also the maximum loss, and cost less than outright options. For moderate directional moves, which occur far more frequently than large breakouts, spread strategies deliver better risk-adjusted returns than plain long calls or puts.
Attention Investors!
Stock Brokers can accept securities as margin from clients only by way of pledge in the depository system w.e.f. September 1, 2020. Update your mobile number & email Id with your stock broker/depository participant and receive OTP directly from the depository on your email id and/or mobile number to create a pledge. Pay 20% upfront margin of the transaction early to trade in the cash market segment. Investors may please refer to the Exchange’s Frequently Asked Questions (FAQs) issued vide circular reference NSE/INSP/45191 dated July 31, 2020, and NSE/INSP/45534 dated August 31, 2020, and other guidelines issued from time to time in this regard. Check your Securities /MF/ Bonds in the consolidated account statement issued by NSDL/CDSL every month.
Corporate Office: No. 153/2, 3rd Floor, M.R.B.Arcade, Bagalur Main Road, Dwaraka Nagar, Yelahanka, Bengaluru – 560 063, Karnataka.
Registered Office: Old No.56/2 ,New No.58, LIC Nagar, Vinayagar Kovil Street, Erode -8,Tamil Nadu– 638002.
Alice Blue Financial Services (P) Ltd : NSE EQ | NSE FO | NSE CDS-90112 SEBI REG : INZ000156038
Alice Blue Financial Services (P) Ltd : BSE EQ | BSE FO | BSE CD-6670 SEBI REG : INZ000156038
Alice Blue Financial Services (P) Ltd : CDSL DP ID 12085300 DP SEBI REG : IN-DP-364-2018
Alice Blue Financial Services (P) Ltd : MCX-56710 SEBI REG : INZ000156038
We hereby declare that we are doing PRO trading
Procedure to file a complaint on SEBI SCORES : Register on SEBI SCORES 2.0. Mandatory details for filing complaints on SCORES: Name, PAN, Address, Mobile Number, E-mail ID. Benefits: Effective Communication, Speedy redressal of the grievances
Click on the provided link to learn about the process for submitting a complaint on the ODR platform for resolving investor grievances.
Investment in securities markets are subject to market risks, read all the related documents carefully before investing. Brokerage will not exceed SEBI prescribed limit.
For queries regarding account opening or activation, email to [email protected] and for fund updates, email to [email protected]
Disclaimer : Prevent unauthorized transactions in your account. Update your mobile numbers/email IDs with your stock brokers. Receive information of your transactions directly from Exchange on your mobile/email at the end of the day. Issued in the interest of investors. All clients have to update their email id and mobile number with Member : Investor Grievance [email protected]
KYC is a one time exercise while dealing in securities markets – once KYC is done through a SEBI registered intermediary (broker, DP, Mutual Fund etc.), you need not undergo the same process again when you approach another intermediary.
No need to issue cheques by investors while subscribing to an IPO. Just write the bank account number and sign in the application form to authorise your bank to make payment in case of allotment. No worries for refund as the money remains in the investor’s account.
Investors are requested to note that Alice Blue Financial Services Private Limited is permitted to receive money from investor through designated bank accounts only named as Up streaming Client Nodal Bank Account (USCNBA). Alice Blue Financial Services Private Limited is also required to disclose these USCNB accounts to Stock Exchange. Hence, you are requested to use following USCNB accounts only for the purpose of dealings in your trading account with us. The details of these USCNB accounts are also displayed by Stock Exchanges on their website under “Know/ Locate your Stock Broker. Bank Details (Valid UPI FAQ).


