
A stock is moving higher, but is that move being supported by trading activity?
The On-Balance Volume indicator, or OBV, helps traders compare price movement with volume. Instead of looking at individual volume bars, OBV converts volume into a cumulative line that rises when price closes higher and falls when price closes lower.
The idea is simple: if price and OBV move in the same direction, the volume trend is broadly confirming the price trend. If they begin moving differently, traders may pay closer attention.
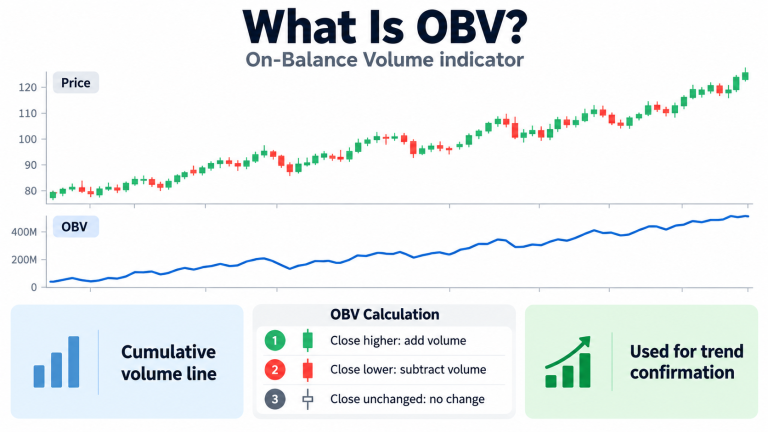
On-Balance Volume (OBV) is a cumulative volume-based technical indicator.
If the current closing price is higher than the previous close, the period’s entire volume is added to OBV. If the close is lower, that volume is subtracted. If the close is unchanged, OBV stays the same.
Traders mainly use OBV to confirm trends and spot divergence between price and volume. The direction of the OBV line is usually more important than the actual numerical value.
On-Balance Volume, commonly called OBV, is a technical indicator that combines closing-price direction with trading volume.
It was introduced by Joe Granville in the 1960s and was built around the idea that changes in volume may sometimes appear before a clear change in price. That does not mean OBV can predict price reliably. It simply explains the theory behind using volume as an early warning or confirmation tool.
OBV is displayed as a line below the price chart. When the current period closes above the previous period’s close, the full volume is added to the OBV total. When price closes lower, the full volume is subtracted.
This means OBV does not care whether the price moved by ₹1 or ₹100. It only looks at whether the close finished higher, lower, or unchanged.
SEBI’s investor-education material describes technical analysis as the study of price movements, trends and trading volumes, which is the broader context in which OBV is used. Investors who want the regulatory education perspective can refer to SEBI’s guide on Technical Analysis vs Fundamental Analysis.
The formula is simple.
If the current close is higher than the previous close:
Current OBV = Previous OBV + Current Volume
If the current close is lower:
Current OBV = Previous OBV − Current Volume
If the closing price is unchanged:
Current OBV = Previous OBV
Suppose a stock shows the following data:
Day | Closing Price | Volume | OBV Change |
Day 1 | ₹100 | 10 lakh | Starting point |
Day 2 | ₹104 | 15 lakh | +15 lakh |
Day 3 | ₹102 | 8 lakh | -8 lakh |
Day 4 | ₹106 | 20 lakh | +20 lakh |
On Day 2, the stock closed higher, so 15 lakh volume was added. On Day 3, the stock closed lower, so 8 lakh was subtracted. Day 4 closed higher, so another 20 lakh was added.
The actual OBV number is usually not the main focus. What matters more is whether the line is trending higher, lower, or moving differently from price.
The easiest way to read OBV is to compare its direction with the price chart. If price is making higher highs and higher lows while OBV is also rising, the cumulative volume trend is broadly confirming the uptrend. If price is making lower highs and lower lows while OBV is falling, the indicator is confirming the downtrend.
The more interesting situation appears when price and OBV stop moving together. Suppose a stock continues to make new highs, but OBV stops making new highs. The price is still rising, but the cumulative volume trend is no longer confirming the move in the same way. That difference is called divergence.
If you are new to technical indicators, Alice Blue’s guide on how to read intraday indicators and buy-sell signals also explains why indicators should be read with price and volume rather than treated as automatic signals.
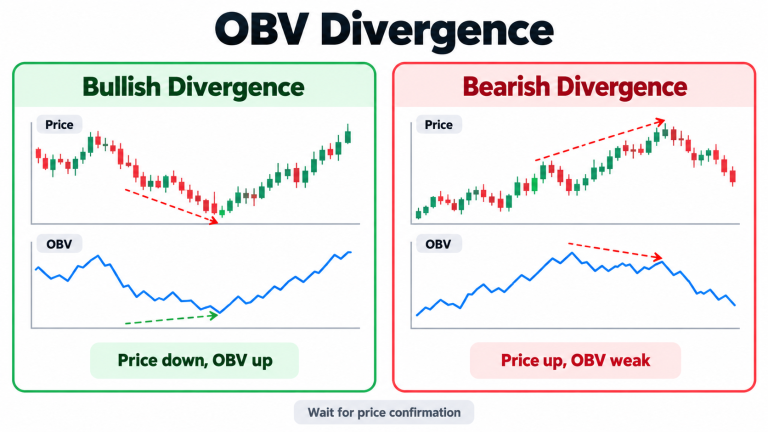
Divergence happens when price and OBV move in different directions.
Bullish divergence occurs when price continues falling, but OBV starts rising or forms a higher low. Imagine a stock falls from ₹500 to ₹470 and later drops to ₹450. If OBV does not make a new low and instead begins moving upward, the decline is no longer being fully confirmed by the volume trend.
Traders may treat this as a warning that the selling trend is weakening, but it is not an automatic buy signal.
Bearish divergence occurs when price moves higher, but OBV fails to make a corresponding high or begins falling.
Suppose a stock rises from ₹800 to ₹850 and later reaches ₹880, while OBV remains below its earlier peak. The price is still rising, but the cumulative volume trend is weaker.
This may warn that the upward trend is losing confirmation. Divergence can continue for a long time, so traders usually wait for price confirmation rather than acting on OBV alone.
Suppose a stock is trading near ₹1,000 and has been rising for several weeks.
Price moves from ₹1,000 to ₹1,080, while OBV also trends higher. This shows that the price trend and cumulative volume trend are moving together.
The stock then rises further to ₹1,120, but OBV starts moving sideways instead of making new highs. At this stage, a trader may become more cautious because the latest price high is not being confirmed by a new OBV high.
If price later breaks below an important support area and OBV also turns lower, the combined evidence is stronger than using the divergence alone.
This is where support and resistance become useful. Alice Blue’s guide to support and resistance trading explains how traders identify price zones where the market has reacted before. OBV can then be used as an additional check on whether volume behaviour supports that price move.
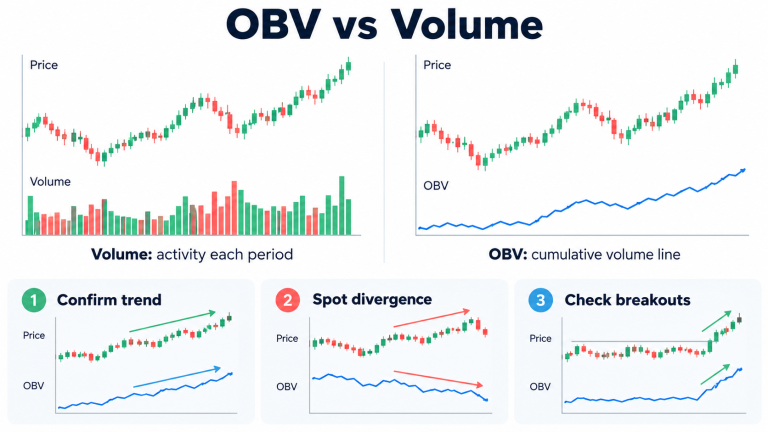
Normal volume and OBV use the same underlying trading-volume data, but they display it differently.
Feature | Normal Volume | OBV |
Display | Individual bars | Cumulative line |
Shows | Activity during each period | Running volume based on closing direction |
Main use | Measure participation | Confirm trends and identify divergence |
Uses price direction? | No | Yes |
Predicts direction? | No | No |
Normal volume tells you how much traded during one period. OBV takes that volume and adds or subtracts it from a running total depending on whether the closing price moved up or down.
For derivatives traders, normal volume should also not be confused with Open Interest. Volume measures how many contracts traded during a period, while Open Interest measures how many contracts remain open. Alice Blue’s guide on Open Interest and Volume in options trading explains this difference in more detail.
The most common use is trend confirmation. When both price and OBV are rising, the uptrend has volume confirmation. When both are falling, the downtrend is also being confirmed.
OBV can also be useful when price moves sideways. If price remains in a range while OBV gradually rises, traders may view that as possible accumulation. If OBV falls while price remains range-bound, it may suggest possible distribution.
These terms should be used carefully. OBV does not tell you whether institutions or any specific group of traders are buying or selling. It only shows how cumulative volume behaves relative to closing-price direction.
Some traders also compare OBV breakouts with price breakouts. If price moves above resistance and OBV also reaches a new high, the move may have stronger confirmation than a breakout where OBV remains weak.
OBV generally works better alongside support and resistance, trendlines, price structure, or moving averages rather than as a standalone trading signal.
Yes. OBV uses the price and volume data of the timeframe shown on the chart. On a daily chart, it uses daily closing prices and daily volume. On a one-hour chart, it uses hourly closes and hourly volume.
This means OBV can look different across timeframes. A stock may show bullish OBV behaviour on an intraday chart while the daily OBV remains weak.
Traders should therefore use a timeframe that matches their trading horizon.
OBV assigns the full period’s volume to one direction.
Suppose a stock trades 50 lakh shares and closes only ₹1 above the previous close. OBV adds the entire 50 lakh. If the stock instead closes ₹1 lower, the entire 50 lakh is subtracted.
The indicator does not consider how large the price movement was. This simplicity is one reason OBV is easy to use, but it also means a single unusually high-volume period can create a large jump in the OBV line.
SEBI also advises market participants to understand their risk appetite and the impact of market volatility before trading in securities. Its investor guide on key risks in the securities market gives a useful regulatory overview.
The On-Balance Volume indicator converts trading volume into a cumulative line based on whether price closes higher or lower than the previous period.
Its main purpose is to help traders see whether volume is confirming the price trend.
When price and OBV rise together, the trend has stronger confirmation. When they begin moving differently, divergence can warn that the existing move is losing support from cumulative volume.
OBV is simple and useful, but it should not be treated as a prediction tool. It works best when combined with price action, market structure, and proper risk management
On-Balance Volume, or OBV, is a cumulative technical indicator that adds volume when price closes higher and subtracts volume when price closes lower.
A rising OBV means more cumulative volume has occurred on periods that closed higher than on periods that closed lower. Traders often use it as confirmation of an uptrend.
A falling OBV means more cumulative volume is being subtracted because of periods closing lower. When price is also falling, this can confirm a downtrend.
Bullish divergence happens when price moves lower while OBV begins rising or forms a higher low. It can warn that the price decline is losing volume confirmation.
Bearish divergence happens when price reaches higher levels while OBV fails to make a new high or begins declining. It can warn that an uptrend is losing confirmation.
Attention Investors!
Stock Brokers can accept securities as margin from clients only by way of pledge in the depository system w.e.f. September 1, 2020. Update your mobile number & email Id with your stock broker/depository participant and receive OTP directly from the depository on your email id and/or mobile number to create a pledge. Pay 20% upfront margin of the transaction early to trade in the cash market segment. Investors may please refer to the Exchange’s Frequently Asked Questions (FAQs) issued vide circular reference NSE/INSP/45191 dated July 31, 2020, and NSE/INSP/45534 dated August 31, 2020, and other guidelines issued from time to time in this regard. Check your Securities /MF/ Bonds in the consolidated account statement issued by NSDL/CDSL every month.
Corporate Office: No. 153/2, 3rd Floor, M.R.B.Arcade, Bagalur Main Road, Dwaraka Nagar, Yelahanka, Bengaluru – 560 063, Karnataka.
Registered Office: Old No.56/2 ,New No.58, LIC Nagar, Vinayagar Kovil Street, Erode -8,Tamil Nadu– 638002.
Alice Blue Financial Services (P) Ltd : NSE EQ | NSE FO | NSE CDS-90112 SEBI REG : INZ000156038
Alice Blue Financial Services (P) Ltd : BSE EQ | BSE FO | BSE CD-6670 SEBI REG : INZ000156038
Alice Blue Financial Services (P) Ltd : CDSL DP ID 12085300 DP SEBI REG : IN-DP-364-2018
Alice Blue Financial Services (P) Ltd : MCX-56710 SEBI REG : INZ000156038
We hereby declare that we are doing PRO trading
Procedure to file a complaint on SEBI SCORES : Register on SEBI SCORES 2.0. Mandatory details for filing complaints on SCORES: Name, PAN, Address, Mobile Number, E-mail ID. Benefits: Effective Communication, Speedy redressal of the grievances
Click on the provided link to learn about the process for submitting a complaint on the ODR platform for resolving investor grievances.
Investment in securities markets are subject to market risks, read all the related documents carefully before investing. Brokerage will not exceed SEBI prescribed limit.
For queries regarding account opening or activation, email to [email protected] and for fund updates, email to [email protected]
Disclaimer : Prevent unauthorized transactions in your account. Update your mobile numbers/email IDs with your stock brokers. Receive information of your transactions directly from Exchange on your mobile/email at the end of the day. Issued in the interest of investors. All clients have to update their email id and mobile number with Member : Investor Grievance [email protected]
KYC is a one time exercise while dealing in securities markets – once KYC is done through a SEBI registered intermediary (broker, DP, Mutual Fund etc.), you need not undergo the same process again when you approach another intermediary.
No need to issue cheques by investors while subscribing to an IPO. Just write the bank account number and sign in the application form to authorise your bank to make payment in case of allotment. No worries for refund as the money remains in the investor’s account.
Investors are requested to note that Alice Blue Financial Services Private Limited is permitted to receive money from investor through designated bank accounts only named as Up streaming Client Nodal Bank Account (USCNBA). Alice Blue Financial Services Private Limited is also required to disclose these USCNB accounts to Stock Exchange. Hence, you are requested to use following USCNB accounts only for the purpose of dealings in your trading account with us. The details of these USCNB accounts are also displayed by Stock Exchanges on their website under “Know/ Locate your Stock Broker. Bank Details (Valid UPI FAQ).


