
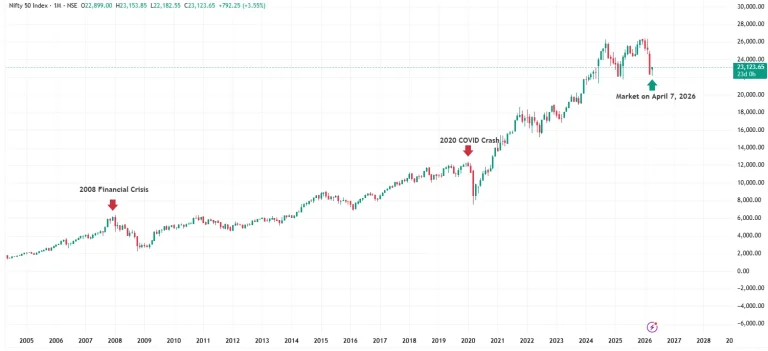
In 2026, the Nifty 50 Index is trading around the 23,000 level. For Indian investors, whether you are just beginning with your first SIP or already managing a diversified portfolio, the Nifty 50 serves as the primary benchmark for the Indian equity market. Understanding the Nifty 50 is essential for anyone investing in India through mutual funds, ETFs, or direct equities.
In this complete guide, we explain exactly what the Nifty 50 Index is, how it works, its history, current composition, historical performance, risks, benefits, and the practical steps to invest in it in 2026.
The Nifty 50 Index is India’s benchmark stock market index that tracks the performance of 50 large-cap companies listed on the National Stock Exchange of India. It represents around 50–60% of the total market capitalisation and is widely used to measure the overall performance of the Indian equity market.
These 50 blue-chip stocks represent roughly 54% of the total free-float market capitalisation of all stocks on the NSE. In simple words, when the Nifty 50 moves, it shows how “India Inc.” is doing.
Key Facts About Nifty 50:
It’s the Indian equivalent of America’s S&P 500, but built specifically for our economy.
The Nifty 50 uses the free-float market capitalisation method. Only the shares actually available for trading are counted. This makes the index more accurate and reflective of real market liquidity.
Nifty 50 Index Formula:
The index is rebalanced twice a year (cut-off dates: January 31 and July 31). Companies can enter or exit based on strict rules for market cap and liquidity. This keeps the Nifty 50 fresh and relevant.
The Nifty 50 has grown alongside modern India:
It has survived the 2008 global crisis, the 2020 COVID crash (and its record recovery), and multiple market cycles. Over 30 years, it has become the backbone of Indian investing, powering index funds, ETFs, and F&O contracts worth trillions.
The Nifty 50 is heavily tilted toward stable, high-quality sectors. Here’s the latest sectoral breakdown (as of the March 30, 2026 rebalance):
Sectoral Weightage:
Top 10 Companies by Weight (as of March 30, 2026):
Rank | Company | Sector | Weight (%) |
1 | HDFC Bank Ltd. | Financial Services | 10.94 |
2 | Reliance Industries Ltd. | Oil, Gas & Fuels | 8.87 |
3 | ICICI Bank Ltd. | Financial Services | 8.42 |
4 | Bharti Airtel Ltd. | Telecommunication | 5.34 |
5 | Infosys Ltd. | Information Technology | 4.28 |
6 | Larsen & Toubro Ltd. | Construction | 4.02 |
7 | State Bank of India | Financial Services | 3.97 |
8 | Axis Bank Ltd. | Financial Services | 3.26 |
9 | ITC Ltd. | FMCG | 2.71 |
10 | Mahindra & Mahindra Ltd. | Automobile | 2.58 |
These weights change daily with market movements and are updated during rebalancing.
Many new investors get confused between the two. Here’s a clear comparison:
Feature | Nifty 50 | Sensex |
Number of stocks | 50 | 30 |
Exchange | NSE | BSE |
Launch year | 1996 | 1986 |
Market coverage | ~54% of NSE free-float | ~40% of BSE |
Popularity for ETFs/F&O | Higher | Lower |
Best for | Broad representation | Legacy benchmark |
Note: The Nifty 50 is more widely used for passive investing (index funds & ETFs) because it has more stocks and better liquidity in derivatives.
Here are the numbers that matter:
The Nifty 50 Total Return Index (which includes dividends) has never given negative returns over any 7-year or 10-year rolling period, proving its power for long-term wealth creation.
Real-life example: A ₹10,000 monthly SIP since 2010 would have grown into several lakhs by 2026, far outpacing fixed deposits or gold for most periods.
No investment is risk-free. The Nifty 50 can fall 20-30% in bad years (like early 2026 volatility). It’s heavily weighted toward financials, so banking crises affect it more. It has zero exposure to small/mid-caps. Always invest with a 5-10+ year horizon.
Tax: Long-term capital gains (>1 year) taxed at 12.5% above ₹1.25 lakh & short-term capital gains (< 1 year) taxed at 20%.
Instead of buying an index fund or ETF, you can technically build your own version of the Nifty 50 by buying all 50 constituent stocks yourself, in the same weights NSE Indices uses. This is sometimes called direct indexing. Here’s how it works, and an honest look at whether it’s actually worth doing.
What it actually involves. You’d buy shares of all 50 companies listed in this guide’s composition table – HDFC Bank, Reliance, ICICI Bank, and so on; in proportion to their free-float weights. Instead of holding one ETF unit or one index fund NAV, you’d directly own 50 individual stock positions replicating the same index.
The real reason to do this and it’s not what most people assume. The traditional pitch is “save on fund fees,” but that argument barely holds up anymore. Nifty 50 index funds and ETFs already run expense ratios as low as 0.05% to 0.2% for direct plans, as covered earlier in this guide — there simply isn’t much fee to save by doing it yourself. The legitimate reason to go direct is customization. A direct approach lets you include or exclude specific stocks or entire sectors from the index, something no off-the-shelf fund allows. For example, if you already have heavy exposure to Financial Services through other investments, you could deliberately underweight it below the index’s current 35.45% weighting, or exclude a specific company you don’t want to hold, while still tracking the broad shape of the Nifty 50.
The honest trade-offs before you attempt this:
If you still want to do it, here’s the practical process:
The honest verdict: for most retail investors, an ETF or index fund delivers the same outcome with none of this maintenance. Direct replication is only worth the effort if customisation – deliberately excluding a stock or sector – matters more to you than convenience and low tracking error.
The Nifty 50 isn’t just an index; it’s the simplest, most proven way for ordinary Indians to participate in India’s growth story. Whether you’re starting your first job or planning for retirement, a disciplined investment in the Nifty 50 can help build long-term wealth.
Open your account today with Alce Blue, set up a small SIP of even ₹500-₹1,000, and let the power of compounding work for you.
This is not financial advice. Always consult a SEBI-registered advisor for your personal situation. Past performance does not guarantee future results. Data sourced from NSE Indices Limited and updated as of April 2026.
The Nifty 50 Price Index tracks only the price movement of the 50 stocks. The Nifty 50 Total Return Index (TRI) includes both price changes and dividends that are assumed to be reinvested. All long-term return figures (like the 12.74% CAGR mentioned in this guide) use the TRI because it gives a more realistic picture of actual investor returns.
The index is reviewed semi-annually to ensure only the most liquid large-cap stocks remain.
ETFs usually have the lowest expense ratios; index funds are easier for automatic SIPs without a demat account.
Not directly. When you invest through index funds or ETFs, any dividends paid by the 50 companies are either reinvested (in the growth option) or paid out (in the dividend/IDCW option). The Total Return Index (TRI) assumes dividends are reinvested, which is why TRI returns are higher than the plain price index.
Yes, this is called direct indexing – buying all 50 constituent stocks in their index weights. It requires manual rebalancing twice a year, higher transaction costs from 50 separate trades, and enough capital to hold accurate weights across stocks ranging from roughly 11% to under 1%. Since Nifty index fund expense ratios are already very low, the main reason to do this is customization (excluding a stock or sector), not cost savings.
Attention Investors!
Stock Brokers can accept securities as margin from clients only by way of pledge in the depository system w.e.f. September 1, 2020. Update your mobile number & email Id with your stock broker/depository participant and receive OTP directly from the depository on your email id and/or mobile number to create a pledge. Pay 20% upfront margin of the transaction early to trade in the cash market segment. Investors may please refer to the Exchange’s Frequently Asked Questions (FAQs) issued vide circular reference NSE/INSP/45191 dated July 31, 2020, and NSE/INSP/45534 dated August 31, 2020, and other guidelines issued from time to time in this regard. Check your Securities /MF/ Bonds in the consolidated account statement issued by NSDL/CDSL every month.
Corporate Office: No. 153/2, 3rd Floor, M.R.B.Arcade, Bagalur Main Road, Dwaraka Nagar, Yelahanka, Bengaluru – 560 063, Karnataka.
Registered Office: Old No.56/2 ,New No.58, LIC Nagar, Vinayagar Kovil Street, Erode -8,Tamil Nadu– 638002.
Alice Blue Financial Services (P) Ltd : NSE EQ | NSE FO | NSE CDS-90112 SEBI REG : INZ000156038
Alice Blue Financial Services (P) Ltd : BSE EQ | BSE FO | BSE CD-6670 SEBI REG : INZ000156038
Alice Blue Financial Services (P) Ltd : CDSL DP ID 12085300 DP SEBI REG : IN-DP-364-2018
Alice Blue Financial Services (P) Ltd : MCX-56710 SEBI REG : INZ000156038
We hereby declare that we are doing PRO trading
Procedure to file a complaint on SEBI SCORES : Register on SEBI SCORES 2.0. Mandatory details for filing complaints on SCORES: Name, PAN, Address, Mobile Number, E-mail ID. Benefits: Effective Communication, Speedy redressal of the grievances
Click on the provided link to learn about the process for submitting a complaint on the ODR platform for resolving investor grievances.
Investment in securities markets are subject to market risks, read all the related documents carefully before investing. Brokerage will not exceed SEBI prescribed limit.
For queries regarding account opening or activation, email to [email protected] and for fund updates, email to [email protected]
Disclaimer : Prevent unauthorized transactions in your account. Update your mobile numbers/email IDs with your stock brokers. Receive information of your transactions directly from Exchange on your mobile/email at the end of the day. Issued in the interest of investors. All clients have to update their email id and mobile number with Member : Investor Grievance [email protected]
KYC is a one time exercise while dealing in securities markets – once KYC is done through a SEBI registered intermediary (broker, DP, Mutual Fund etc.), you need not undergo the same process again when you approach another intermediary.
No need to issue cheques by investors while subscribing to an IPO. Just write the bank account number and sign in the application form to authorise your bank to make payment in case of allotment. No worries for refund as the money remains in the investor’s account.
Investors are requested to note that Alice Blue Financial Services Private Limited is permitted to receive money from investor through designated bank accounts only named as Up streaming Client Nodal Bank Account (USCNBA). Alice Blue Financial Services Private Limited is also required to disclose these USCNB accounts to Stock Exchange. Hence, you are requested to use following USCNB accounts only for the purpose of dealings in your trading account with us. The details of these USCNB accounts are also displayed by Stock Exchanges on their website under “Know/ Locate your Stock Broker. Bank Details (Valid UPI FAQ).


