
Bollinger Bands are a technical analysis indicator consisting of a middle Simple Moving Average (SMA) and two outer bands that expand or contract based on stock price volatility. Traders use them to identify dynamic support and resistance, potential price breakouts, and overbought or oversold conditions on stock charts.
In this guide, you will learn how to use Bollinger Bands for stock trading in India, how the indicator works step-by-step, actionable trading strategies, and critical risk management rules for Indian markets.
Developed by technical analyst John Bollinger, Bollinger Bands are a visual tool used to measure market volatility and price levels relative to an average over time.
The indicator is composed of three primary lines plotted directly onto a price chart:
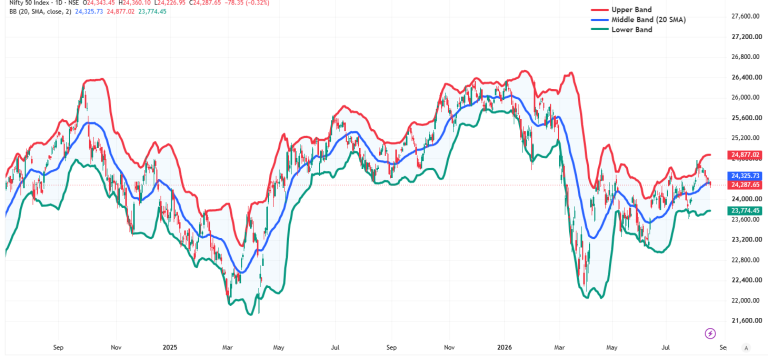
A standard deviation is simply a statistical calculation that measures how far price values fluctuate from their average. When a stock becomes highly volatile (such as during quarterly earnings or major policy updates), the standard deviation rises, causing the upper and lower bands to widen. When price fluctuations settle into a narrow range, the standard deviation falls, causing the bands to contract.
Bollinger Bands function as a dynamic boundary for price action. Under a normal statistical distribution, approximately 95% of all price action occurs inside the outer bands.
Here is how the indicator operates in practice across different market phases, in live Nifty 50 Chart (from period of June 2025 to Aug 17, 2026):
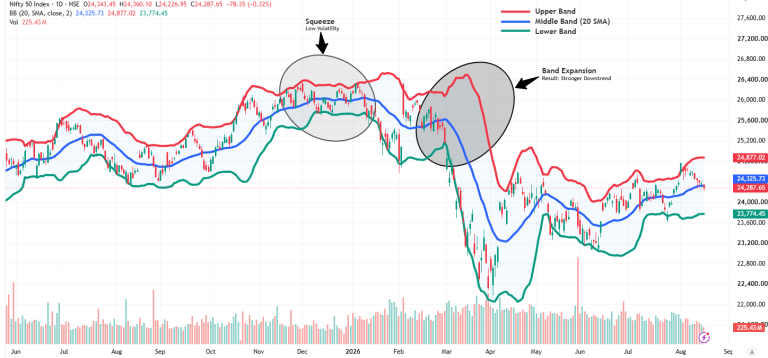
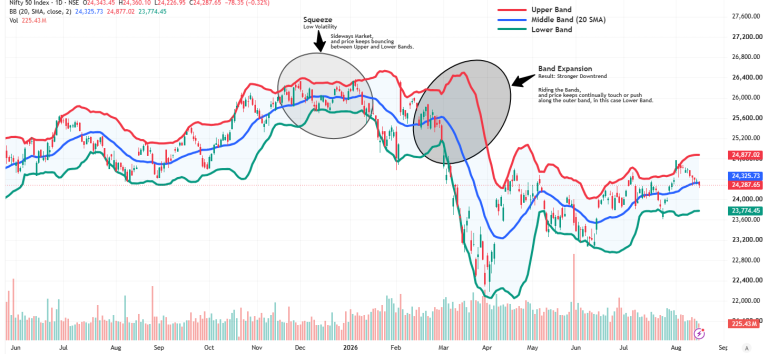
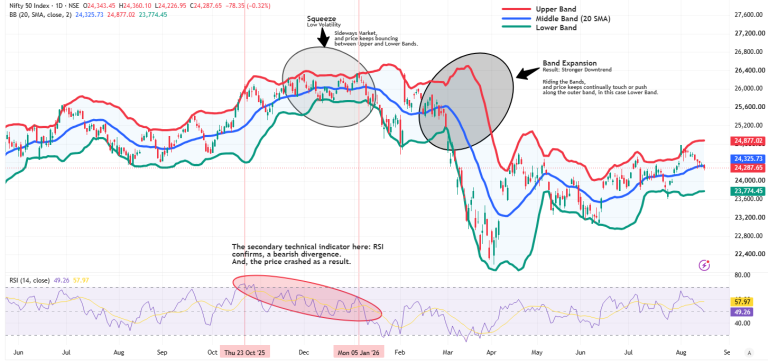
Traders use price action signals (such as candlestick reversal patterns) or secondary technical indicators (like RSI or Volume) at the band boundaries to confirm whether a stock will break out or bounce back toward the average.
To see how a Bollinger Bands trading strategy works in a practical scenario, consider an intraday setup on an Indian large-cap stock like Reliance Industries on a 15-minute chart.
Setup: Stock consolidates in a tight 40-minute squeeze near ₹2,980.
Breakout Trigger: A bullish candle closes above the Upper Band at ₹3,000 with trading volume 35% higher than the 10-period average.
Entry Price: ₹3,002 (at the open of the subsequent candle)
Stop-Loss: ₹2,980 (placed at the Middle Band / 20 SMA)
Risk Per Share: ₹22
Target Price: ₹3,046 (maintaining a 1:2 Risk-to-Reward ratio)
Result: Target hit within 45 minutes as volatility expanded.
Comparing Bollinger Bands to a standard Simple Moving Average highlights why adding volatility bands improves decision-making:
Feature | Simple Moving Average (SMA) | Bollinger Bands |
Primary Function | Tracks average price direction | Tracks average price and volatility |
Visual Structure | Single line tracking trend | Three lines creating a dynamic channel |
Volatility Context | None | High (widening bands) or Low (narrowing bands) |
Breakout Detection | Weak (shows average cross only) | Strong (detects volatility squeezes) |
Best Used For | Basic trend identification | Volatility timing, mean reversion, and breakouts |
Bollinger Bands are one of the most effective technical indicators available to stock traders in India. By giving you a clear view of market volatility, this tool helps you distinguish between sideways consolidation and explosive trend breakouts.
To trade successfully, avoid treating the outer bands as rigid buy or sell triggers. Instead, use them as dynamic reference zones combined with price action patterns, volume, and disciplined risk management.
Bonus: If you enjoyed this blog and found it valuable, check out “7 Best Indicators for Swing Trading,” written by the same author.
The standard setting of 20 periods and 2 standard deviations (20, 2) on a 5-minute or 15-minute candlestick chart works best for intraday trading on NSE stocks and indices like Nifty 50.
No. Touching the upper band simply means the price is relatively high compared to its 20-period average. In strong bull trends, stock prices can continually push along the upper band for extended periods.
A popular combination strategy is looking for confluence: buy when price touches or pierces the lower Bollinger Band while the 14-period RSI drops below 30 (oversold condition), backed by a bullish reversal candlestick pattern.
Yes. Options buyers frequently look for a “Bollinger Band Squeeze” on 3-minute or 5-minute index charts. When the squeeze breaks with strong volume, option premiums often expand rapidly as Implied Volatility (IV) increases.
You can use stock screening platforms like Chartink or TradingView India by building a filter for the BandWidth Indicator, and look for stocks where the BandWidth value drops to a multi-week low (typically below 3% to 5%). This instantly filters out consolidated stocks that are preparing for an explosive breakout.
Overnight news or global market moves often cause Indian stocks to open with a significant gap. A large gap causes the bands to instantly expand, which can distort standard deviation metrics on lower timeframes. If a stock gaps open far outside the upper or lower band at 9:15 AM, avoid chasing it immediately. Wait 15 to 30 minutes for price action to settle, as prices frequently pull back toward the 20 SMA middle band to fill the opening gap.
Option buyers benefit most during a squeeze. Low volatility during consolidation keeps Implied Volatility (IV) and option premiums low. Buying calls or puts right as the price breaks out allows option buyers to profit from both directional momentum and IV expansion. Conversely, option sellers prefer wide, expanding bands or range-bound markets where option premiums are higher and time decay works in their favour.
Multi-timeframe analysis helps filter out false signals. Start on a higher timeframe (such as the Daily or 1-Hour chart) to establish the broader trend by checking whether prices are holding above or below the 20 SMA middle band. Once the direction is confirmed, zoom in to a lower timeframe (such as 5-minute or 15-minute) to execute trades exclusively in the direction of that higher-timeframe trend.
No. Bollinger Bands rely on standard deviation math, which requires liquid, continuous price distribution. Low-volume or illiquid penny stocks often experience irregular trading gaps and upper/lower circuit limits. This distorts standard deviation calculations, rendering the outer bands unreliable and prone to severe false signals.
Attention Investors!
Stock Brokers can accept securities as margin from clients only by way of pledge in the depository system w.e.f. September 1, 2020. Update your mobile number & email Id with your stock broker/depository participant and receive OTP directly from the depository on your email id and/or mobile number to create a pledge. Pay 20% upfront margin of the transaction early to trade in the cash market segment. Investors may please refer to the Exchange’s Frequently Asked Questions (FAQs) issued vide circular reference NSE/INSP/45191 dated July 31, 2020, and NSE/INSP/45534 dated August 31, 2020, and other guidelines issued from time to time in this regard. Check your Securities /MF/ Bonds in the consolidated account statement issued by NSDL/CDSL every month.
Corporate Office: No. 153/2, 3rd Floor, M.R.B.Arcade, Bagalur Main Road, Dwaraka Nagar, Yelahanka, Bengaluru – 560 063, Karnataka.
Registered Office: Old No.56/2 ,New No.58, LIC Nagar, Vinayagar Kovil Street, Erode -8,Tamil Nadu– 638002.
Alice Blue Financial Services (P) Ltd : NSE EQ | NSE FO | NSE CDS-90112 SEBI REG : INZ000156038
Alice Blue Financial Services (P) Ltd : BSE EQ | BSE FO | BSE CD-6670 SEBI REG : INZ000156038
Alice Blue Financial Services (P) Ltd : CDSL DP ID 12085300 DP SEBI REG : IN-DP-364-2018
Alice Blue Financial Services (P) Ltd : MCX-56710 SEBI REG : INZ000156038
We hereby declare that we are doing PRO trading
Procedure to file a complaint on SEBI SCORES : Register on SEBI SCORES 2.0. Mandatory details for filing complaints on SCORES: Name, PAN, Address, Mobile Number, E-mail ID. Benefits: Effective Communication, Speedy redressal of the grievances
Click on the provided link to learn about the process for submitting a complaint on the ODR platform for resolving investor grievances.
Investment in securities markets are subject to market risks, read all the related documents carefully before investing. Brokerage will not exceed SEBI prescribed limit.
For queries regarding account opening or activation, email to [email protected] and for fund updates, email to [email protected]
Disclaimer : Prevent unauthorized transactions in your account. Update your mobile numbers/email IDs with your stock brokers. Receive information of your transactions directly from Exchange on your mobile/email at the end of the day. Issued in the interest of investors. All clients have to update their email id and mobile number with Member : Investor Grievance [email protected]
KYC is a one time exercise while dealing in securities markets – once KYC is done through a SEBI registered intermediary (broker, DP, Mutual Fund etc.), you need not undergo the same process again when you approach another intermediary.
No need to issue cheques by investors while subscribing to an IPO. Just write the bank account number and sign in the application form to authorise your bank to make payment in case of allotment. No worries for refund as the money remains in the investor’s account.
Investors are requested to note that Alice Blue Financial Services Private Limited is permitted to receive money from investor through designated bank accounts only named as Up streaming Client Nodal Bank Account (USCNBA). Alice Blue Financial Services Private Limited is also required to disclose these USCNB accounts to Stock Exchange. Hence, you are requested to use following USCNB accounts only for the purpose of dealings in your trading account with us. The details of these USCNB accounts are also displayed by Stock Exchanges on their website under “Know/ Locate your Stock Broker. Bank Details (Valid UPI FAQ).


