
The Hanging Man is a candlestick pattern that appears after a price rise. It has a small body near the top of the candle and a long lower shadow, showing that the price fell during the session before recovering. Traders may read it as a warning that buying strength is fading, but it does not confirm a reversal. They often wait for a later price move and assess the wider chart before concluding.
he Hanging Man is a one-candle pattern that may warn of a possible change in direction after a price rise. It has a small body near the candle’s high and a long lower shadow.
A candlestick shows four prices for a chosen period: the open (where the period began), high (highest price), low (lowest price), and close (where it ended). The body shows the distance between the open and close. The thin lines above and below it are called shadows or wicks.
The long lower shadow means the price fell well below the open or close during the period, then recovered before the candle ended. Buyers were still active, but the sharp drop may suggest that selling pressure is emerging. The same candle shape after a fall is usually called a Hammer; the trend before the candle changes how traders read it.
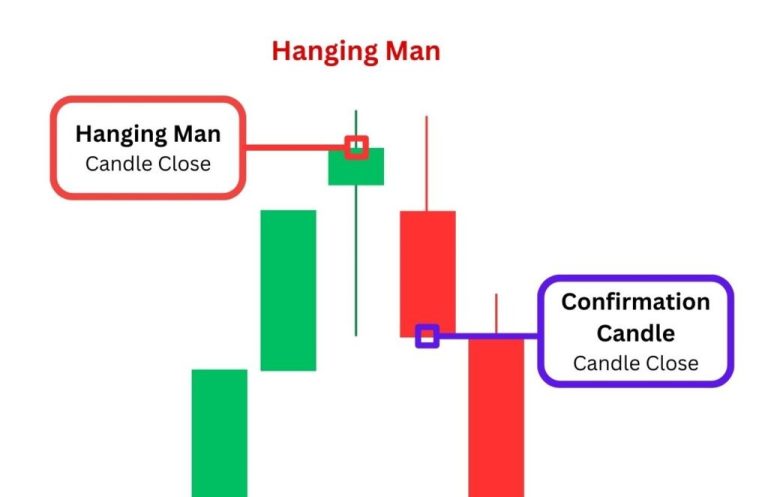
Start by checking the trend: a Hanging Man is considered only after prices have been rising. A few rising candles or a series of higher swing highs and higher lows can help show that the price has been moving up. One candle alone does not establish a trend.
Then look at the candle’s shape:
A common visual guide is for the lower shadow to be about twice the length of the body or longer. This is a rule of thumb, not a fixed test that makes a signal reliable.
Basic measurements
The body can be red or green. A red body means the close was below the open; a green body means it was above. Colour alone does not confirm what prices will do next.
A Hanging Man is a warning to examine the chart, not a command to sell. Traders may assess it alongside the prior trend, nearby price levels, and what happens in later sessions. The NSE’s technical-analysis material covers candlesticks alongside trend, support and resistance, volume and risk management, useful reminders that a pattern is one part of chart analysis, not a complete trading plan.
A trader might look for a later candle to close below the Hanging Man’s body or low as one possible sign that selling pressure has continued. There is no single confirmation rule used by every trader, and a later decline still does not guarantee that the price will keep falling.
Volume can add context. For example, a trader might compare the pattern candle’s volume with recent sessions and see whether trading activity increased. Higher volume does not prove a reversal; it is only one piece of information.
The figures below are hypothetical and illustrate how a trader might calculate risk. They are not a real NSE trade or a recommendation.
Suppose a share has risen from ₹480 to ₹520 over several sessions. It then forms a candle with:
Price point | Amount |
Open | ₹518 |
High | ₹520 |
Low | ₹506 |
Close | ₹517 |
The body is ₹1 long (₹518 minus ₹517). The lower shadow is ₹11 long (₹517 minus ₹506). Since the candle appears after a rise, its shape may fit the common visual description of a Hanging Man.
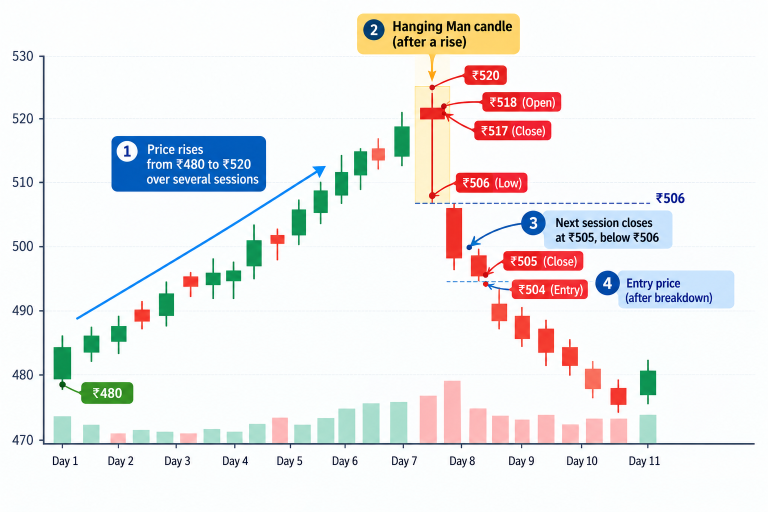
Suppose the next session closes at ₹505, below the candle’s low of ₹506. For illustration, a trader might decide that a price moving below ₹506 meets their pre-set confirmation rule, then assume an entry at ₹504. The actual entry price could differ because prices move while an order is placed or executed.
If the trader uses ₹521, the Hanging Man’s high, as a reference for where the trade idea would no longer fit the plan, the price difference is ₹17 per share (₹521 minus ₹504). With a maximum planned loss of ₹1,700, the illustrative quantity is 100 shares (₹1,700 divided by ₹17), before brokerage, taxes, slippage, or other costs.
This calculation only shows how position size can be related to a planned loss. A stop order may execute at a different price, and the pattern may fail.
The pattern gives traders a simple reason to review a rising share for signs that its price behaviour may be changing. It can also provide a visible high or low to refer to when setting out what would invalidate a trading idea.
But the pattern can fail. The price may continue rising, and a long lower shadow may reflect a temporary dip that buyers recovered. Short-term charts can also show more price fluctuations, making a single candle easier to misread. Volume or other chart tools may add context, but none can guarantee a correct outcome.
There is a behavioural risk too: seeing a pattern and rushing into a trade before the plan is clear. A stop-loss can help manage a planned exit, but it does not guarantee a maximum loss if the price gaps or moves quickly. Avoid using leverage or a position size you cannot afford to lose.
The candle shapes are similar. Their position in the preceding trend is what changes their usual interpretation.
Feature | Hanging Man | Hammer |
Appears after | A price rise | A price fall |
Possible meaning | Warning of potential selling pressure | Possible sign that selling pressure is easing |
Shape | Small body near the top, long lower shadow | Small body near the top, long lower shadow |
What traders may look for | Later price weakness | Later price strength |
Main caution | The price may keep rising | The price may keep falling |
The Hanging Man may help active traders who already understand candlestick charts and want to watch for possible weakness after a rise. It can be studied alongside trend direction, nearby levels and a clear risk plan.
It may be less useful as a standalone tool for a new trader who has not yet learnt to read a chart or size a position. Long-term investors may also find a single short-term candle less relevant to decisions based on a company’s longer-term prospects. Beginners can learn the pattern without placing a live trade.
The Hanging Man is a candle with a small body near the top and a long lower shadow, appearing after a price rise. It may alert traders to selling pressure, but it does not prove that the price will fall. Check the preceding trend, understand the candle’s shape, and decide what confirmation means for your own method. If you use it to plan a trade, calculate your potential loss and position size first. Treat the pattern as one chart clue—not a forecast or a promise of profit.
After a price rise, it may warn that selling pressure is increasing. It does not confirm a reversal, so traders often examine later price action and the wider chart.
Look for a small body near the candle’s high, a long lower shadow, and a preceding uptrend. A lower shadow about twice the body’s length is a common visual guide, not a guarantee.
A red candle closes below its open, which shows that the close was lower than the open during that period. The candle’s position and what happens next matter more than colour alone.
They have a similar shape, but usually appear after different trends. A Hanging Man follows a rise; a Hammer follows a fall.
Many traders use a later price move—such as a close below the candle’s low—as one possible confirmation rule. Traders use different methods, and confirmation does not guarantee that a decline will continue.
Attention Investors!
Stock Brokers can accept securities as margin from clients only by way of pledge in the depository system w.e.f. September 1, 2020. Update your mobile number & email Id with your stock broker/depository participant and receive OTP directly from the depository on your email id and/or mobile number to create a pledge. Pay 20% upfront margin of the transaction early to trade in the cash market segment. Investors may please refer to the Exchange’s Frequently Asked Questions (FAQs) issued vide circular reference NSE/INSP/45191 dated July 31, 2020, and NSE/INSP/45534 dated August 31, 2020, and other guidelines issued from time to time in this regard. Check your Securities /MF/ Bonds in the consolidated account statement issued by NSDL/CDSL every month.
Corporate Office: No. 153/2, 3rd Floor, M.R.B.Arcade, Bagalur Main Road, Dwaraka Nagar, Yelahanka, Bengaluru – 560 063, Karnataka.
Registered Office: Old No.56/2 ,New No.58, LIC Nagar, Vinayagar Kovil Street, Erode -8,Tamil Nadu– 638002.
Alice Blue Financial Services (P) Ltd : NSE EQ | NSE FO | NSE CDS-90112 SEBI REG : INZ000156038
Alice Blue Financial Services (P) Ltd : BSE EQ | BSE FO | BSE CD-6670 SEBI REG : INZ000156038
Alice Blue Financial Services (P) Ltd : CDSL DP ID 12085300 DP SEBI REG : IN-DP-364-2018
Alice Blue Financial Services (P) Ltd : MCX-56710 SEBI REG : INZ000156038
We hereby declare that we are doing PRO trading
Procedure to file a complaint on SEBI SCORES : Register on SEBI SCORES 2.0. Mandatory details for filing complaints on SCORES: Name, PAN, Address, Mobile Number, E-mail ID. Benefits: Effective Communication, Speedy redressal of the grievances
Click on the provided link to learn about the process for submitting a complaint on the ODR platform for resolving investor grievances.
Investment in securities markets are subject to market risks, read all the related documents carefully before investing. Brokerage will not exceed SEBI prescribed limit.
For queries regarding account opening or activation, email to [email protected] and for fund updates, email to [email protected]
Disclaimer : Prevent unauthorized transactions in your account. Update your mobile numbers/email IDs with your stock brokers. Receive information of your transactions directly from Exchange on your mobile/email at the end of the day. Issued in the interest of investors. All clients have to update their email id and mobile number with Member : Investor Grievance [email protected]
KYC is a one time exercise while dealing in securities markets – once KYC is done through a SEBI registered intermediary (broker, DP, Mutual Fund etc.), you need not undergo the same process again when you approach another intermediary.
No need to issue cheques by investors while subscribing to an IPO. Just write the bank account number and sign in the application form to authorise your bank to make payment in case of allotment. No worries for refund as the money remains in the investor’s account.
Investors are requested to note that Alice Blue Financial Services Private Limited is permitted to receive money from investor through designated bank accounts only named as Up streaming Client Nodal Bank Account (USCNBA). Alice Blue Financial Services Private Limited is also required to disclose these USCNB accounts to Stock Exchange. Hence, you are requested to use following USCNB accounts only for the purpose of dealings in your trading account with us. The details of these USCNB accounts are also displayed by Stock Exchanges on their website under “Know/ Locate your Stock Broker. Bank Details (Valid UPI FAQ).


