
You have probably looked at a Nifty 50 chart and wondered why it rises in bursts, pulls back, and then rises again. Elliott Wave Theory tries to explain that rhythm. It says price moves in a repeating pattern of five waves with the trend, followed by three waves against it. This guide covers the Elliott wave pattern, its rules, a worked example with numbers, and the limits you should know before trading on it.
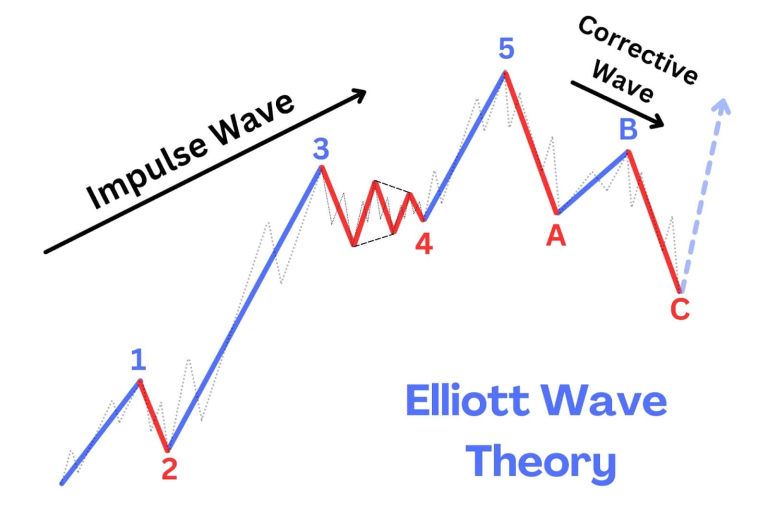
Elliott Wave Theory is a form of technical analysis that studies recurring price patterns to estimate where a market may go next. Ralph Nelson Elliott developed it in the 1930s. He believed prices move in repeating patterns because of shared investor psychology.
The idea is simple. When prices rise, optimism spreads slowly and then quickly. Then people get greedy, and later they get fearful. These mood swings show up on a chart as waves.
The theory works on any chart you can read: stocks, indices like Nifty and Bank Nifty, commodities, and currencies. It falls under technical analysis, which uses price and volume rather than company financials.
The pattern has two parts. Impulse waves move with the main trend and have five smaller waves. Corrective waves move against the trend and have three smaller waves.
Here is the sequence in an uptrend:
Elliott wave analysts treat these as fixed. If any rule breaks, the count is wrong, and you need to relabel it.
Traders pair the waves with Fibonacci retracement levels to estimate where a pullback may end. Pullbacks often stop near 38.2 percent, 50 percent, or 61.8 percent of the previous move. A retracement of this kind is simply the percentage of the earlier rise that price gives back.
Wave | Typical Fibonacci relationship |
Wave 2 | Retraces 50 percent to 78.6 percent of Wave 1 |
Wave 3 | Often reaches 161.8 percent of Wave 1 |
Wave 4 | Retraces 23.6 percent to 38.2 percent of Wave 3 |
Wave 5 | Often equals Wave 1, or 61.8 percent to 161.8 percent of the length from start of Wave 1 to top of Wave 3 |
In many impulses, one of the three motive waves (usually Wave 3) is extended, meaning it is much longer than the others. If Wave 3 is extended, Waves 1 and 5 tend to be about equal in length.
Truncation, or a truncated fifth, happens when Wave 5 fails to go beyond the end of Wave 3. This often occurs after a very strong Wave 3, or when sentiment shifts sharply against the trend.
The numbers below are made up to show the method. They are not a real Nifty 50 record or a trade recommendation.
Say a stock like Infosys moves like this:
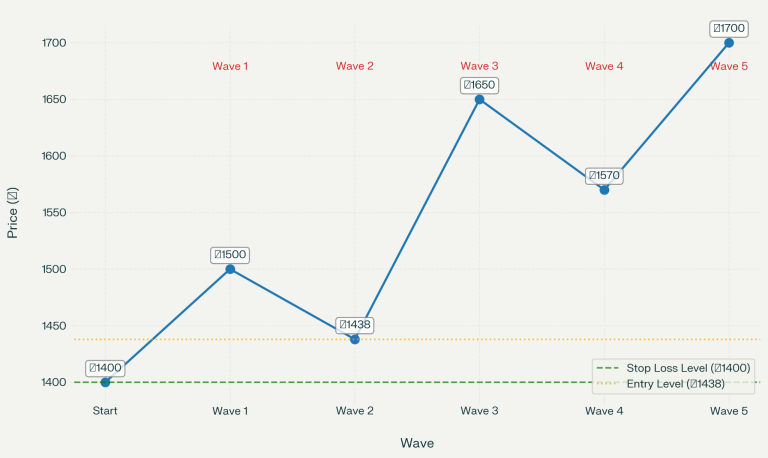
Wave | Move | Price in rupees | Size in rupees |
Start | Low | 1400 | – |
Wave 1 | Up | 1500 | 100 |
Wave 2 | Down | 1438 | 62 (62 percent of Wave 1) |
Wave 3 | Up | 1650 | 212 |
Wave 4 | Down | 1570 | 80 |
Wave 5 | Up | 1700 | 130 |
Check the rules. Wave 2 held above 1400, so it passed. Wave 3 (212) is longer than Wave 1 (100) and Wave 5 (130), so it passed. Wave 4 low (1570) stayed above the Wave 1 high (1500), so there was no overlap.
Now the trade idea. A trader who waits for the Wave 2 pullback might buy near 1438, just above the 61.8 percent level (a 61.8 percent pullback of Wave 1, which is 100, takes price to about 1438). They place a stop loss at 1400, a risk of 38 per share. If Wave 3 reaches 1650, the gain is 212 per share, a reward-to-risk ratio of about 5.6 to 1. For every 1 rupee at risk, the example aims for about 5.60 rupees.
For 100 shares, the risk is 3800 rupees and the potential gain is 21200 rupees. If the price breaks 1400 instead, the count is invalid, and the stop loss limits the loss. Costs like brokerage and taxes will reduce both numbers.
After Wave 5 at 1700, a three-wave correction may follow. A trader holding the stock may then tighten the stop or book profit.
Degree | Typical timeframe |
Grand Supercycle | Decades |
Supercycle | Many years |
Cycle | One to several years |
Primary | Months to a year |
Intermediate | Weeks to months |
Minor | Days to weeks |
Minute | Hours to days |
Minuette | Minutes to hours |
The biggest problem is subjectivity. Two analysts can count the same chart differently, and both can sound convincing. A count that looks right today can be relabelled tomorrow after new candles form.
There are also behavioural risks. Traders often force a pattern onto the chart because they want a certain outcome. This is seeing only what you want to see on the chart. Others hold on to a losing trade because it is only Wave 4 and refuse to accept the stop loss.
On the financial side, trading in futures and options with leverage can turn a wrong count into a large loss quickly. Learning the theory also takes time, since real charts are rarely as clean as textbook diagrams.
Be careful in sideways, low-volume stocks where patterns are unclear.
You can chart and practise on the Alice Blue trading platform after you open a demat account.
Parameter | Elliott Wave Theory | Dow Theory |
Core idea | Prices move in 5- to 3-wave cycles | Market has primary, secondary, and minor trends |
Focus | Pattern counting and targets | Trend confirmation across indices |
Subjectivity | High | Lower |
Best for | Timing entries, exits and targets | Identifying the broader trend |
Learning curve | Steep | Moderate |
Tools used | Fibonacci, wave rules | Volume, index confirmation |
Many traders use Dow Theory to identify the direction and Elliott Wave to time the entry.
It suits swing traders and positional traders who are comfortable studying charts and can wait for setups. Technical analysts who like Fibonacci levels will also find it useful, and long-term investors can use it to see whether the market may be late in a cycle.
It is less suitable for complete beginners who want quick signals, and for people who cannot spend time learning chart patterns. If you prefer rule-based, mechanical systems, the subjectivity may frustrate you.
Elliott Wave Theory describes market trends as five waves with the trend and three against it, driven by crowd psychology. It gives structure for entries, targets, and stop-loss levels, but wave counting is subjective and can mislead. Learn the three rules, practise on higher timeframes, confirm counts with other indicators, and keep your risk small. Treat it as one tool among several, not a prediction method. No single tool tells you what price will do next. Always use a stop loss and keep your position size small.
It says market prices move in repeating waves: five in the direction of the trend and three against it. These waves reflect changing investor emotions.
No method is fully accurate. Counts are subjective, so analysts often disagree. It works better when combined with other indicators and strict stop losses.
Waves 1, 3, and 5 move with the trend, and Waves 2 and 4 are pullbacks. Wave 3 is usually the strongest.
Wave 2 cannot retrace more than 100 percent of Wave 1. Wave 3 cannot be the shortest of the three impulse waves. Wave 4 cannot overlap Wave 1.
It is learnable, but harder than basic tools like support and resistance. Start with the rules and higher timeframes, and practise before using real money.
Yes, it works on any timeframe. Intraday waves are noisier and need quick decisions, so beginners are better off on daily charts.
Fibonacci retracement is the most common pairing. RSI, volume, and moving averages help confirm a count.
Wave 3 is usually the longest and strongest, with strong volume and momentum. Wave 5 often shows weaker momentum and may fail to extend far beyond Wave 3.
Attention Investors!
Stock Brokers can accept securities as margin from clients only by way of pledge in the depository system w.e.f. September 1, 2020. Update your mobile number & email Id with your stock broker/depository participant and receive OTP directly from the depository on your email id and/or mobile number to create a pledge. Pay 20% upfront margin of the transaction early to trade in the cash market segment. Investors may please refer to the Exchange’s Frequently Asked Questions (FAQs) issued vide circular reference NSE/INSP/45191 dated July 31, 2020, and NSE/INSP/45534 dated August 31, 2020, and other guidelines issued from time to time in this regard. Check your Securities /MF/ Bonds in the consolidated account statement issued by NSDL/CDSL every month.
Corporate Office: No. 153/2, 3rd Floor, M.R.B.Arcade, Bagalur Main Road, Dwaraka Nagar, Yelahanka, Bengaluru – 560 063, Karnataka.
Registered Office: Old No.56/2 ,New No.58, LIC Nagar, Vinayagar Kovil Street, Erode -8,Tamil Nadu– 638002.
Alice Blue Financial Services (P) Ltd : NSE EQ | NSE FO | NSE CDS-90112 SEBI REG : INZ000156038
Alice Blue Financial Services (P) Ltd : BSE EQ | BSE FO | BSE CD-6670 SEBI REG : INZ000156038
Alice Blue Financial Services (P) Ltd : CDSL DP ID 12085300 DP SEBI REG : IN-DP-364-2018
Alice Blue Financial Services (P) Ltd : MCX-56710 SEBI REG : INZ000156038
We hereby declare that we are doing PRO trading
Procedure to file a complaint on SEBI SCORES : Register on SEBI SCORES 2.0. Mandatory details for filing complaints on SCORES: Name, PAN, Address, Mobile Number, E-mail ID. Benefits: Effective Communication, Speedy redressal of the grievances
Click on the provided link to learn about the process for submitting a complaint on the ODR platform for resolving investor grievances.
Investment in securities markets are subject to market risks, read all the related documents carefully before investing. Brokerage will not exceed SEBI prescribed limit.
For queries regarding account opening or activation, email to [email protected] and for fund updates, email to [email protected]
Disclaimer : Prevent unauthorized transactions in your account. Update your mobile numbers/email IDs with your stock brokers. Receive information of your transactions directly from Exchange on your mobile/email at the end of the day. Issued in the interest of investors. All clients have to update their email id and mobile number with Member : Investor Grievance [email protected]
KYC is a one time exercise while dealing in securities markets – once KYC is done through a SEBI registered intermediary (broker, DP, Mutual Fund etc.), you need not undergo the same process again when you approach another intermediary.
No need to issue cheques by investors while subscribing to an IPO. Just write the bank account number and sign in the application form to authorise your bank to make payment in case of allotment. No worries for refund as the money remains in the investor’s account.
Investors are requested to note that Alice Blue Financial Services Private Limited is permitted to receive money from investor through designated bank accounts only named as Up streaming Client Nodal Bank Account (USCNBA). Alice Blue Financial Services Private Limited is also required to disclose these USCNB accounts to Stock Exchange. Hence, you are requested to use following USCNB accounts only for the purpose of dealings in your trading account with us. The details of these USCNB accounts are also displayed by Stock Exchanges on their website under “Know/ Locate your Stock Broker. Bank Details (Valid UPI FAQ).


