
Imagine watching your favorite stock plummet for weeks, erasing your hard-earned gains. You feel a sinking sense of regret. Then, suddenly, green appears on your screen, and the stock surges 8% in one session. Relief washes over you; you believe the bottom is finally in and pour more cash into the position to “buy the dip.” But within days, the stock violently reverses, plunging 15% lower than before. You didn’t catch a market recovery; you walked straight into a trap.
Every trader eventually faces a scenario where a heavily declining stock suddenly experiences a sharp, unexpected upward rally. To an untrained eye, this sudden surge looks like a structural trend reversal and an ideal buying opportunity. However, experienced market participants know that these rapid spikes are often temporary illusions.
In this article, you will learn exactly how to identify a dead cat bounce stock market pattern, why these false rallies happen, and how to use technical indicators to protect your trading capital from heavy losses.
A dead cat bounce in the stock market is a temporary, short-lived recovery in the price of a declining stock, followed closely by a continuation of the primary downtrend. It is a false rally, often called a bull trap, that creates a deceptive illusion of a market reversal when the underlying fundamentals remain weak.
The concept of a dead cat bounce is derived from an old Wall Street saying: “Even a dead cat will bounce if it falls from a great height.” Translated to the stock market, it means that even the weakest, fundamentally broken stocks will experience minor price increases during a severe sell-off. This happens due to mechanical market forces rather than actual operational improvements within the underlying company.
In the Indian share market, this phenomenon is frequently observed during bear markets or when a specific stock hits a major negative trigger, such as a severe earnings miss, regulatory actions by SEBI or the RBI, or a structural breakdown in its sector. The bounce occurs because stock prices never move down in a perfectly straight line; instead, they decline in jagged waves dictated by short-term shifts in supply and demand.
A dead cat bounce progresses through a highly predictable sequence of market movements across the trading sessions:
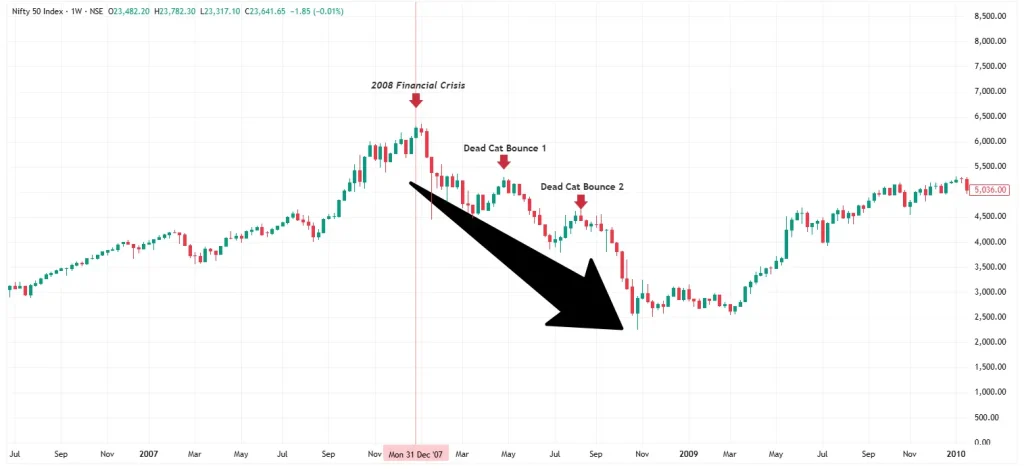
A historic, macro-level example of a dead cat bounce stock market event occurred on the benchmark Nifty 50 index during the infamous 2008 Global Financial Crisis.
When the US subprime mortgage meltdown began triggering global panic, the Indian market was hit by aggressive Foreign Institutional Investor (FII) outflows. The Nifty 50 index had hit a massive peak of 6,138.60 in December 2007 before entering a brutal bear market. By March 2008, the index had experienced a sharp, multi-month freefall, crashing by over 22% to sit at 4,734.50.
At this point, the market staged a highly deceptive recovery. Media narratives eagerly claimed that the Indian economy was “decoupled” from the West, which prompted institutional short-sellers to book profits and emotional retail investors to aggressively buy the dip. This wave of buying pushed the Nifty 50 all the way back up to 5,165.90 in April 2008, a major relief rally of over 9% that convinced thousands of traders that the worst was over.
However, the global systemic crisis was far from resolved. Once short-term short covering dried up, the underlying macro headwinds took back full control. Aggressive institutional dumping resumed, and by June 2008, the index completely smashed through its previous support floor, crashing down to 4,040.55 before eventually hitting a historic trough near the 2,500 mark in early 2009. The sharp April 2008 jump up to 5,165 was a textbook, market-wide dead cat bounce that trapped billions in retail capital.
Spotting a dead cat bounce in real-time requires looking past the daily green candles and focusing on structural chart indicators. Here is how to identify the pattern on your charting platform:
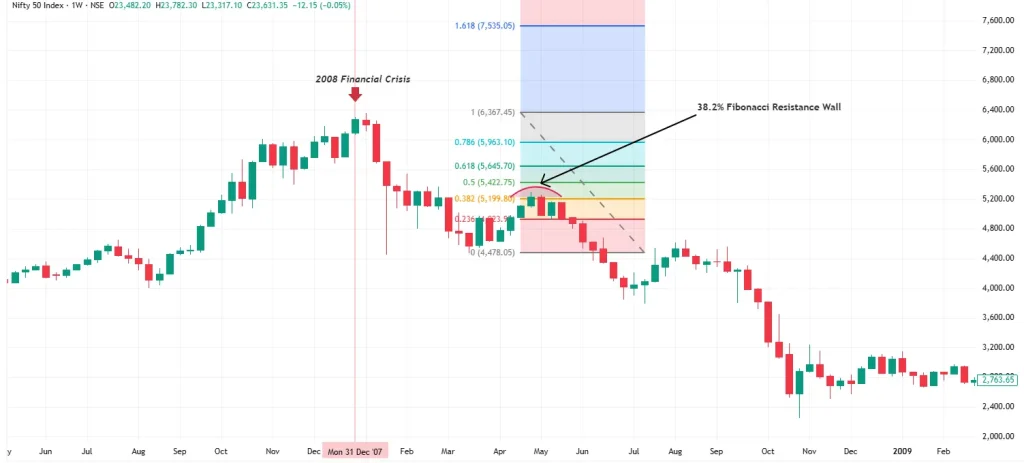
When a stock rebounds, plot the Fibonacci Retracement tool from the absolute peak of the initial crash to the local bottom. A classic dead cat bounce will stage a quick rally but will sharply stall, face heavy selling pressure, and fail to sustain a daily close above the 38.2% Fibonacci level. If it cannot clear this line, the rally is highly deceptive.
This is your most reliable confirmation tool. Look closely at the volume bars at the bottom of your chart:
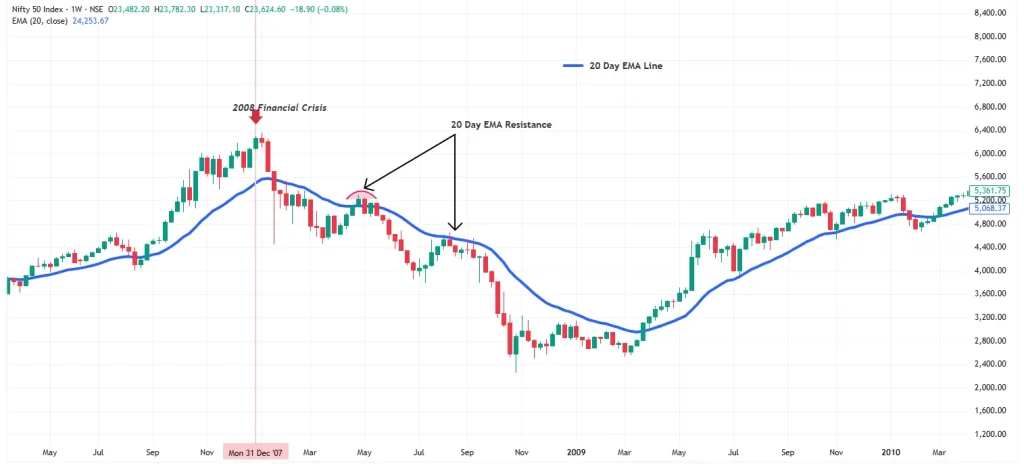
In a strong structural downtrend, the 20-day Exponential Moving Average (EMA) acts as a dynamic ceiling. During a false recovery, the stock price will often spike up toward the 20-day EMA line but fail to register consecutive daily closes above it. A sharp rejection wick at this moving average is a clear sign that bears are reloading their short positions.
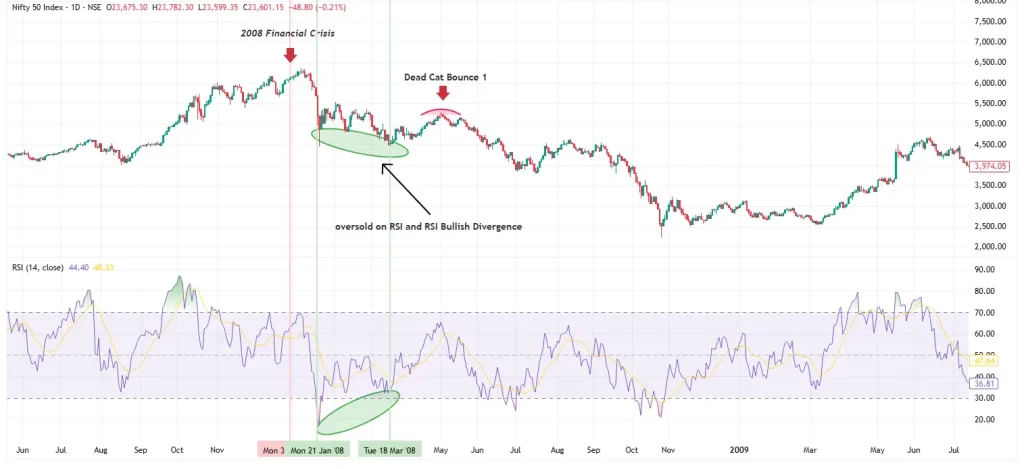
Check the Relative Strength Index (RSI) on the Daily (1D) timeframe. Before the bounce, the RSI will typically be heavily oversold (below 30 or even 20). The subsequent price rally is often just a mechanical relief of this extreme technical reading. The RSI will crawl back up toward the 45–50 zone, but without entering true bullish territory, before turning back downward.
To learn more about RSI Bullish Divergence, read “What Is the RSI (Relative Strength Index) and How Do You Use It? Complete Guide for 2026”.
You can easily identify this deceptive pattern by tracking these core characteristics:
Developing a deep understanding of this market pattern provides structural advantages to your trading approach:
While identifying this pattern is highly beneficial, traders must be aware of its specific limitations:
If you are navigating a volatile market environment, implement these disciplined habits to safeguard your capital:
To avoid costly mistakes, you must learn to distinguish a structural turnaround from a mechanical market reaction.
Feature | Dead Cat Bounce (False Rally) | True Trend Reversal (Bullish Turn) |
Trading & Delivery Volume | Decreases or stays flat as the price ticks upward. | Increases substantially, indicating Domestic Institutional Investor (DII) buying. |
Fundamental Trigger | Driven entirely by market noise, technical oversold conditions, or short covering. | Backed by concrete structural triggers (e.g., earnings turnaround, debt reduction). |
Pattern Duration | Highly brief; usually ranges between 3 and 14 days. | Sustained over several months, establishing a new bull run. |
Chart Structure | Forms a clear lower high and breaks to a lower low. | Successfully breaks through major resistance levels and forms higher lows. |
Avoid these frequent traps that retail market participants fall into during major market corrections:
Protecting your trading capital during a market correction comes down to strict execution discipline. Use these rules to ensure you do not buy into a false recovery:
Never buy the very first green rally off a market bottom. Instead, practice patience:
In India, check the delivery percentage data on the NSE or BSE website for the stock during its rally days. If a stock shoots up 5% in a session, but the delivery percentage is exceptionally low (below 25%-30%), it means the entire move was driven by intraday scalpers and speculators squaring off positions. Real, sustainable trend reversals require high delivery accumulation (typically above 50%).
An individual stock rarely reverses its trend in isolation. If you see a banking stock staging a sudden recovery, look at the Nifty Bank or Nifty Private Bank index. If the broader sectoral index is still trading below its key moving averages and making lower lows, treat the individual stock’s rally as a dangerous trap.
If you decide to trade a high-momentum short-term bounce, you must accept that you are trading against the primary trend. Protect yourself by placing a hard, non-negotiable Stop-Loss order exactly 1% below the recent swing low. If the bounce turns out to be a fake-out, your trade will automatically close with a minor, controlled loss before the stock breaks into a deeper freefall.
A dead cat bounce stock market pattern serves as a critical warning that a green day on the charts does not automatically mean a trend reversal has begun. While a rapid upward move can trigger FOMO and create an emotional urge to buy the dip, doing so without looking at volume dynamics and underlying corporate health frequently leads straight into a value trap.
By focusing heavily on volume verification, waiting for structural confirmation via higher lows, and maintaining absolute stop-loss discipline, you can successfully avoid these traps and protect your capital for high-probability opportunities.
This article is for educational purposes only and should not be considered financial advice. Always conduct your own research before investing.
Circuit filters make a false bounce highly dangerous in illiquid stocks. Operators pump the stock into consecutive Upper Circuits to trap buyers. When the bounce fails, the stock hits consecutive Lower Circuits, leaving you completely unable to sell or exit your position.
The Daily (1D) and Weekly (1W) charts are the most reliable. Intraday timeframes (like 5-minute or 15-minute charts) are ineffective because they mostly show minor, short-term market noise rather than a structural false rally.
It comes down to scale and duration. A dead cat bounce is short-lived (3 to 14 days) and typically isolates a single stock or sector. A bear market rally is a broader, market-wide move that can deceptively push major indices upward for several weeks or months.
Look at Fibonacci Retracement levels and the 20-day Exponential Moving Average (EMA). A dead cat bounce usually fails and reverses precisely between the 38.2% and 50% Fibonacci levels, while failing to close above the 20-day EMA.
Since you cannot short delivery shares overnight in India, the safest way is to use the options market. Instead of shorting futures, buy out-of-the-money (OTM) Put Options or deploy a Bear Call Spread to strictly cap your maximum risk.
Attention Investors!
Stock Brokers can accept securities as margin from clients only by way of pledge in the depository system w.e.f. September 1, 2020. Update your mobile number & email Id with your stock broker/depository participant and receive OTP directly from the depository on your email id and/or mobile number to create a pledge. Pay 20% upfront margin of the transaction early to trade in the cash market segment. Investors may please refer to the Exchange’s Frequently Asked Questions (FAQs) issued vide circular reference NSE/INSP/45191 dated July 31, 2020, and NSE/INSP/45534 dated August 31, 2020, and other guidelines issued from time to time in this regard. Check your Securities /MF/ Bonds in the consolidated account statement issued by NSDL/CDSL every month.
Corporate Office: No. 153/2, 3rd Floor, M.R.B.Arcade, Bagalur Main Road, Dwaraka Nagar, Yelahanka, Bengaluru – 560 063, Karnataka.
Registered Office: Old No.56/2 ,New No.58, LIC Nagar, Vinayagar Kovil Street, Erode -8,Tamil Nadu– 638002.
Alice Blue Financial Services (P) Ltd : NSE EQ | NSE FO | NSE CDS-90112 SEBI REG : INZ000156038
Alice Blue Financial Services (P) Ltd : BSE EQ | BSE FO | BSE CD-6670 SEBI REG : INZ000156038
Alice Blue Financial Services (P) Ltd : CDSL DP ID 12085300 DP SEBI REG : IN-DP-364-2018
Alice Blue Financial Services (P) Ltd : MCX-56710 SEBI REG : INZ000156038
We hereby declare that we are doing PRO trading
Procedure to file a complaint on SEBI SCORES : Register on SEBI SCORES 2.0. Mandatory details for filing complaints on SCORES: Name, PAN, Address, Mobile Number, E-mail ID. Benefits: Effective Communication, Speedy redressal of the grievances
Click on the provided link to learn about the process for submitting a complaint on the ODR platform for resolving investor grievances.
Investment in securities markets are subject to market risks, read all the related documents carefully before investing. Brokerage will not exceed SEBI prescribed limit.
For queries regarding account opening or activation, email to [email protected] and for fund updates, email to [email protected]
Disclaimer : Prevent unauthorized transactions in your account. Update your mobile numbers/email IDs with your stock brokers. Receive information of your transactions directly from Exchange on your mobile/email at the end of the day. Issued in the interest of investors. All clients have to update their email id and mobile number with Member : Investor Grievance [email protected]
KYC is a one time exercise while dealing in securities markets – once KYC is done through a SEBI registered intermediary (broker, DP, Mutual Fund etc.), you need not undergo the same process again when you approach another intermediary.
No need to issue cheques by investors while subscribing to an IPO. Just write the bank account number and sign in the application form to authorise your bank to make payment in case of allotment. No worries for refund as the money remains in the investor’s account.
Investors are requested to note that Alice Blue Financial Services Private Limited is permitted to receive money from investor through designated bank accounts only named as Up streaming Client Nodal Bank Account (USCNBA). Alice Blue Financial Services Private Limited is also required to disclose these USCNB accounts to Stock Exchange. Hence, you are requested to use following USCNB accounts only for the purpose of dealings in your trading account with us. The details of these USCNB accounts are also displayed by Stock Exchanges on their website under “Know/ Locate your Stock Broker. Bank Details (Valid UPI FAQ).


