
A stock has been falling for several sessions. Then, after one more strong red candle, a small green candle appears inside it. Has the downtrend ended? Not necessarily, but sellers may be losing control.
The Bullish Harami pattern is a two-candle formation that appears after a price decline. The first candle is large and bearish, while the second has a small bullish body that sits inside the first candle’s body. Traders read it as an early sign that selling pressure may be easing, not as proof that the price will rise.
A Bullish Harami is a possible bullish reversal pattern found after a downtrend. It has a large red candle followed by a smaller green candle whose body lies inside the first candle’s body. The pattern becomes more useful when the next candle confirms buying strength and the setup appears near support, with suitable volume and controlled risk.
A Bullish Harami is a two-candle pattern that can appear near the end of a downtrend. It suggests that the pace of selling has slowed and buyers are starting to respond.
Each candle shows four prices for a selected period: open, high, low, and close. The thick part between the open and close is called the real body. Thin lines above or below it are called wicks or shadows.
A textbook Bullish Harami has:
The wicks need not sit inside the first candle. The real-body relationship is the main test.
The word “Harami” is Japanese for “pregnant”. On a chart, the larger first body appears to contain the smaller second body. The name describes the shape; it does not make the signal certain.
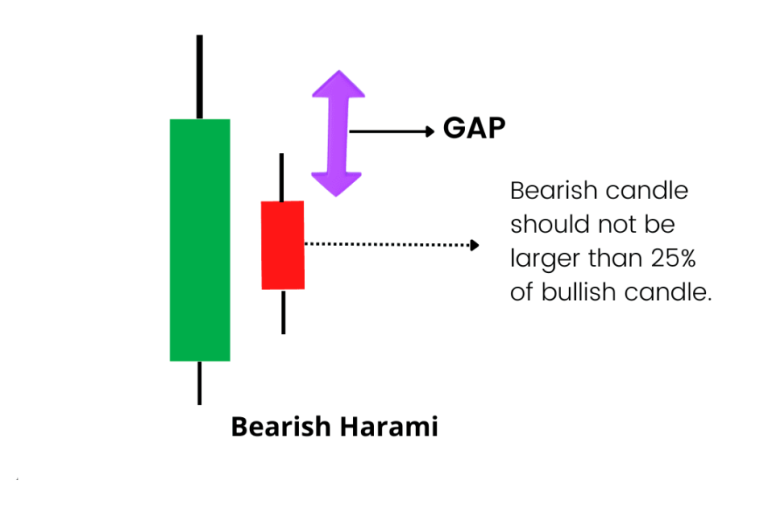
This is why the pattern should be read as an alert, not an automatic buy instruction.
Use this checklist before calling two candles a Bullish Harami:
A small green candle after a long red candle is not enough. If it appears during sideways trading, the formation lacks the downtrend context required for a reversal pattern.
The NIFTY 50 formed a Bullish Harami on 7 and 8 October 2024 after a decline. This example uses recorded index prices rather than invented values.trackstock+1
Session | Open | High | Low | Close | Reading |
7 October 2024 | 25,084.10 | 25,143.00 | 24,694.35 | 24,795.75 | Large bearish candle |
8 October 2024 | 24,832.20 | 25,044.00 | 24,756.80 | 25,013.15 | Smaller bullish body inside Candle 1 |
9 October 2024 | 25,065.80 | 25,234.05 | 24,947.70 | 24,981.95 | Rose intraday, but closed below Candle 2’s close |
On 8 October, the real body ran from 24,832.20 to 25,013.15. It sat inside the 7 October body, which ran from 24,795.75 to 25,084.10. That satisfies the body-containment rule.
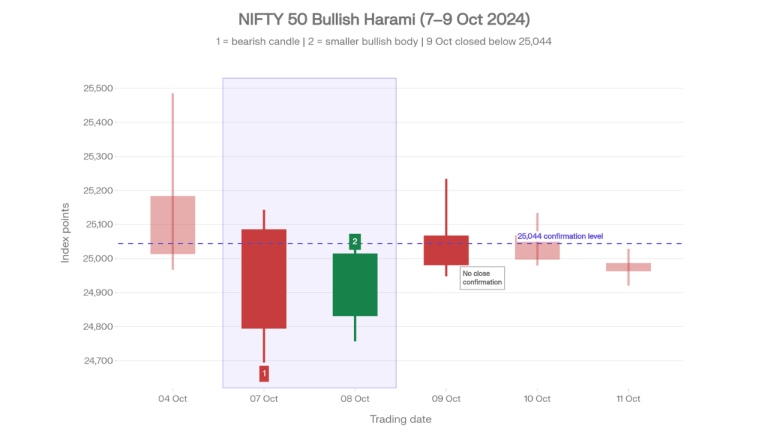
On 9 October, the index traded above the 8 October high of 25,044 and reached 25,234.05, but it closed at 24,981.95—below both the 8 October high and close. Therefore, a trader requiring close confirmation above Candle 2’s high would not have entered. This is a useful example because it shows why an intraday rise and a confirmed closing signal are not the same thing.
There is no single entry rule that suits every trader. The main approaches differ in how much confirmation they require.
Beginners may find a pre-decided close-confirmation rule easier to follow because it removes the pressure to react to every intraday move.
A common stop-loss is placed below the lower low of the two pattern candles. If price breaks that point below, the expected reversal has failed, and the earlier downtrend may be continuing.
Possible target methods include:
No target method guarantees an exit at the best price.
Assume a share gives a confirmed entry at ₹505, and the stop-loss is ₹493.
This is a calculation example, not a historical stock setup. Brokerage, taxes, slippage, and gaps can make the actual loss different.
Both are two-candle patterns that can appear after a downtrend. Their body relationships are opposite.aliceblueonline+1
Point | Bullish Harami | Bullish Engulfing |
First candle | Large bearish body | Small bearish body |
Second candle | Small bullish body | Large bullish body |
Body relationship | Second body sits inside the first | Second body covers the first |
What it first suggests | Selling has slowed | Buyers have reversed the prior body |
Confirmation | Still preferred | Still preferred |
Stop-loss reference | Often below pattern low | Often below pattern low |
The Bullish Harami signals hesitation after selling. The Bullish Engulfing shows a stronger one-session takeover by buyers, but neither pattern guarantees that the rise will continue.
The Bullish Harami is mainly useful to active market participants who already understand basic candles, trend direction, support, and stop-loss orders.
It may suit:
It may be less suitable for someone who wants guaranteed signals, cannot monitor risk, or buys solely because two candles match a shape.
The Bullish Harami pattern is a two-candle sign that selling pressure may be losing strength after a downtrend. A large red candle is followed by a smaller green body contained within it. The pattern is easy to recognise, but it does not confirm that the price will rise. Check the earlier trend, decide what confirmation means before entering, and place the stop-loss at a level that clearly invalidates the setup. Use support, volume, or a simple momentum tool only as supporting evidence, and size the position according to the loss you can accept.
It is better treated as an alert than a direct buy signal. Many traders wait for price to break or close above the second candle’s high before considering an entry.
One common rule is to wait for the next candle to close above the small second candle’s high. A stricter trader may wait for a close above the first candle’s high; the rule should be selected before the trade.
A common reference is just below the lowest low of the two pattern candles. The stop should also fit the trader’s risk limit and account for the share’s usual price movement.
The classic form uses a small bullish, or green, second candle. Some charting definitions accept a small body of either colour, but a green body makes the bullish reading easier for beginners.
No. The main condition is that the second candle’s real body lies inside the first candle’s real body; the wicks can extend beyond it.
A Harami compares the two candles’ real bodies and requires bullish reversal context after a decline. An inside bar usually requires the entire second candle’s high-to-low range to remain inside the first candle’s high-to-low range.
Attention Investors!
Stock Brokers can accept securities as margin from clients only by way of pledge in the depository system w.e.f. September 1, 2020. Update your mobile number & email Id with your stock broker/depository participant and receive OTP directly from the depository on your email id and/or mobile number to create a pledge. Pay 20% upfront margin of the transaction early to trade in the cash market segment. Investors may please refer to the Exchange’s Frequently Asked Questions (FAQs) issued vide circular reference NSE/INSP/45191 dated July 31, 2020, and NSE/INSP/45534 dated August 31, 2020, and other guidelines issued from time to time in this regard. Check your Securities /MF/ Bonds in the consolidated account statement issued by NSDL/CDSL every month.
Corporate Office: No. 153/2, 3rd Floor, M.R.B.Arcade, Bagalur Main Road, Dwaraka Nagar, Yelahanka, Bengaluru – 560 063, Karnataka.
Registered Office: Old No.56/2 ,New No.58, LIC Nagar, Vinayagar Kovil Street, Erode -8,Tamil Nadu– 638002.
Alice Blue Financial Services (P) Ltd : NSE EQ | NSE FO | NSE CDS-90112 SEBI REG : INZ000156038
Alice Blue Financial Services (P) Ltd : BSE EQ | BSE FO | BSE CD-6670 SEBI REG : INZ000156038
Alice Blue Financial Services (P) Ltd : CDSL DP ID 12085300 DP SEBI REG : IN-DP-364-2018
Alice Blue Financial Services (P) Ltd : MCX-56710 SEBI REG : INZ000156038
We hereby declare that we are doing PRO trading
Procedure to file a complaint on SEBI SCORES : Register on SEBI SCORES 2.0. Mandatory details for filing complaints on SCORES: Name, PAN, Address, Mobile Number, E-mail ID. Benefits: Effective Communication, Speedy redressal of the grievances
Click on the provided link to learn about the process for submitting a complaint on the ODR platform for resolving investor grievances.
Investment in securities markets are subject to market risks, read all the related documents carefully before investing. Brokerage will not exceed SEBI prescribed limit.
For queries regarding account opening or activation, email to [email protected] and for fund updates, email to [email protected]
Disclaimer : Prevent unauthorized transactions in your account. Update your mobile numbers/email IDs with your stock brokers. Receive information of your transactions directly from Exchange on your mobile/email at the end of the day. Issued in the interest of investors. All clients have to update their email id and mobile number with Member : Investor Grievance [email protected]
KYC is a one time exercise while dealing in securities markets – once KYC is done through a SEBI registered intermediary (broker, DP, Mutual Fund etc.), you need not undergo the same process again when you approach another intermediary.
No need to issue cheques by investors while subscribing to an IPO. Just write the bank account number and sign in the application form to authorise your bank to make payment in case of allotment. No worries for refund as the money remains in the investor’s account.
Investors are requested to note that Alice Blue Financial Services Private Limited is permitted to receive money from investor through designated bank accounts only named as Up streaming Client Nodal Bank Account (USCNBA). Alice Blue Financial Services Private Limited is also required to disclose these USCNB accounts to Stock Exchange. Hence, you are requested to use following USCNB accounts only for the purpose of dealings in your trading account with us. The details of these USCNB accounts are also displayed by Stock Exchanges on their website under “Know/ Locate your Stock Broker. Bank Details (Valid UPI FAQ).


