
A stock rises quickly, then slips for a few days. Has the rally ended, or is the price taking a break? After a steep fall, a recovery can raise the opposite question: is the decline over, or will it resume?
The bullish flag and bearish flag patterns help traders study those pauses. Each starts with a strong price move, followed by a smaller move against it. Traders then watch whether the price breaks in the direction of the first move.
A bullish flag is a short, narrow pause after a sharp rise. The price often moves slightly down or sideways before breaking above the pause. A bearish flag starts with a sharp fall, followed by a short upward or sideways recovery. Traders then watch for a break below it. The break matters: a rise followed by a dip, or a fall followed by a recovery, does not by itself confirm a flag.
The name describes the shape on a price chart. The pole is a quick move up or down. The flag is the smaller pause that follows it.
In a bull flag pattern, the pole rises, and the pause usually moves slightly down or sideways. In a bear flag pattern, the pole falls, and the pause usually moves slightly up or sideways. Traders call these continuation patterns because they are looking for the earlier move to continue after the pause.
A typical flag is fairly short and narrow. Its upper and lower edges are roughly parallel. If the pause becomes wide or lasts several months, it may be more accurate to call it a channel: a longer price move between two lines.
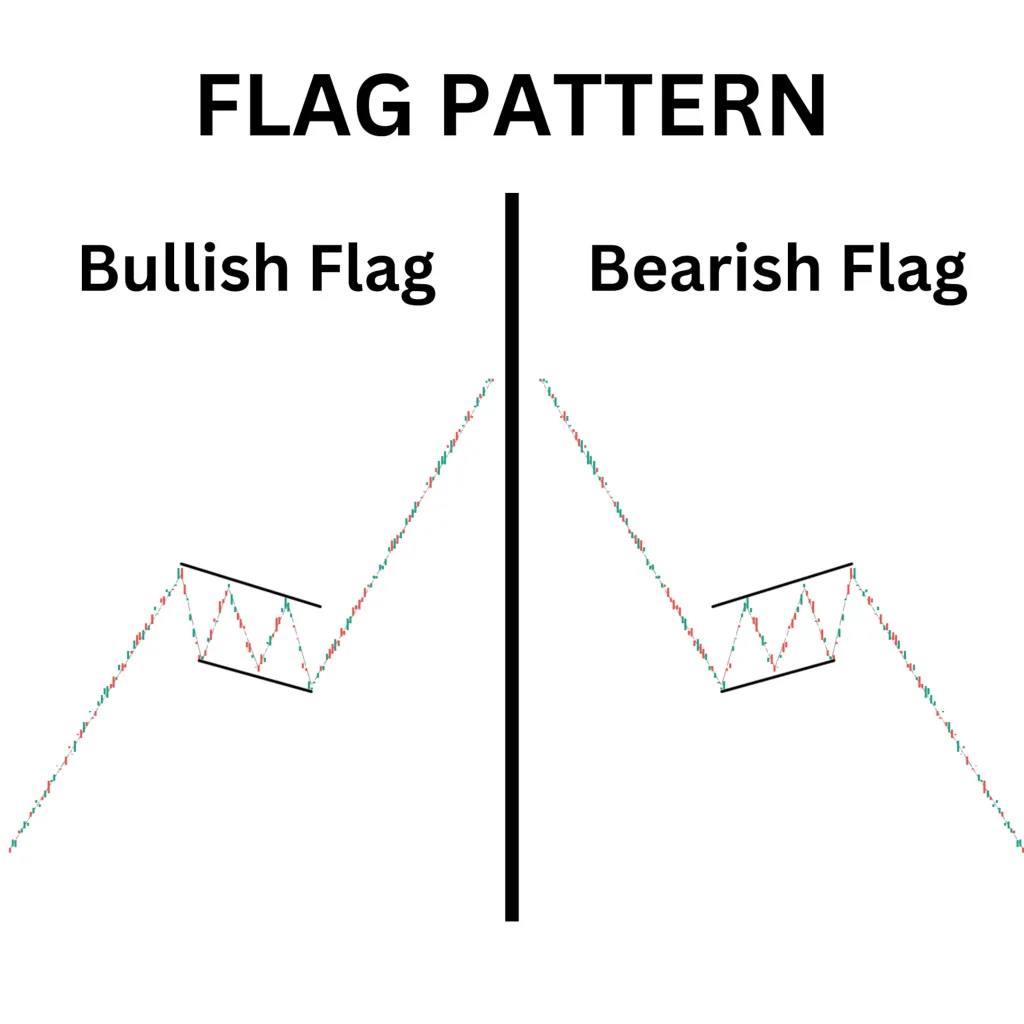
Read the chart in this order:
Some traders measure the pole and project the same distance from the breakout to estimate a target. It is a calculation for planning a trade, not a price the market has to reach.
The weekly chart of Hero MotoCorp shows a practical example of a bullish flag pattern.
The stock first recovered sharply from around ₹3,351.50 on 7 April 2025. It then moved towards the ₹4,300–₹4,400 zone. After this rise, the price did not immediately continue higher. Instead, it moved sideways for several weeks, broadly between ₹4,200 and ₹4,450.
This sideways movement formed the flag. The earlier rise acted as the flagpole.
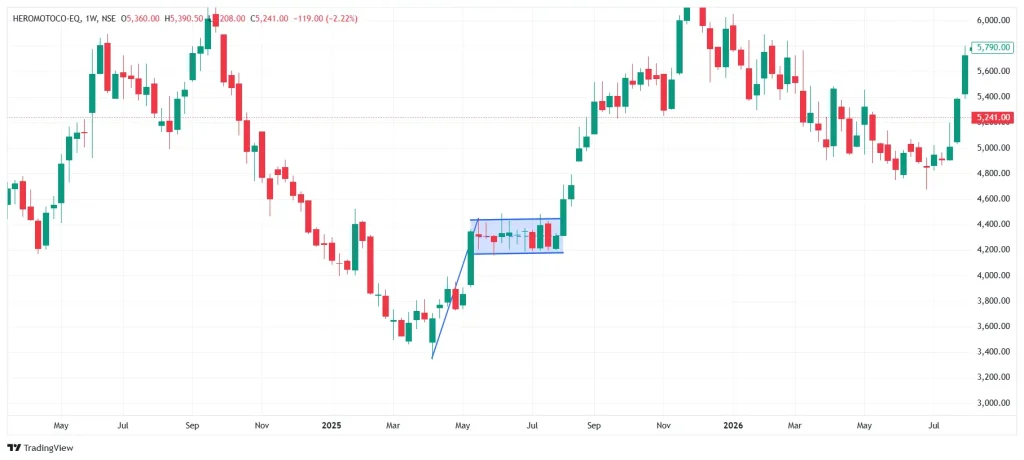
Around 4 August 2025, Hero MotoCorp moved above the upper boundary of the range near the marked ₹4,446.50 level. This was the bullish breakout shown on the chart. The stock then moved higher, later trading above ₹6,000.
Part of the pattern | Approximate level or period |
Support and start of the move | ₹3,351.50 around 7 April 2025 |
Flagpole | Rise towards ₹4,300–₹4,400 |
Flag formation | Sideways movement from May to early August |
Flag range | Approximately ₹4,200–₹4,450 |
Breakout reference | Around ₹4,446.50 |
Later price move | Above ₹6,000 in the months that followed |
The weekly price data shows the stock closing at ₹4,345.30 on 16 May, ₹4,338.50 on 20 June, ₹4,345 on 4 July, and ₹4,311.60 on 1 August. These closes show the extended pause before the August breakout.
The supplied Nifty 50 daily chart shows a bearish continuation setup.
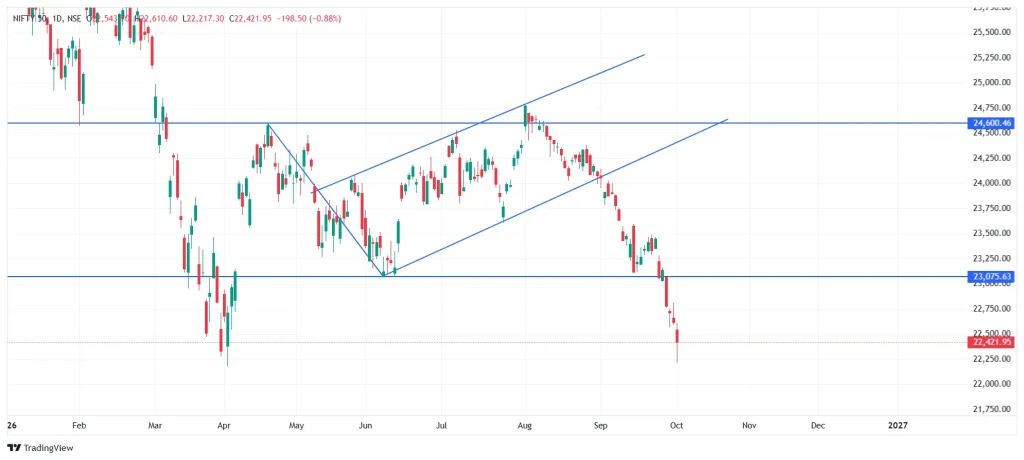
The flagpole began at the high marked around 21 September 2025. Nifty then fell sharply and reached a low around 8 June 2026. This sharp decline forms the flagpole.
After the June low, the index recovered inside a rising channel. The recovery moved upward between two trendlines and lasted from June to early September. This recovery is the flag-style consolidation.
On or around 2 September 2026, Nifty broke below the lower trendline of the rising channel. This was the breakdown. The index then moved lower, slipped below the marked support near 23,075.63, and closed at 22,421.95 on 1 October 2026.
Part of the pattern | Chart reading |
Flagpole begins | High around 21 September 2025 |
Flagpole ends | Low around 8 June 2026 |
Flag forms | Rising channel from June to August |
Breakdown | Around 2 September 2026 |
Important resistance | Near 24,600.46 |
Important support | Near 23,075.63 |
Later close | 22,421.95 on 1 October 2026 |
Consider a separate, hypothetical stock example. An NSE-listed stock climbs from ₹400 to ₹480, making an ₹80 pole. It pauses between ₹458 and ₹470, then closes at ₹472. A trader might consider an entry near ₹472, with a stop-loss at ₹455, below the pause.
Planned level | Amount |
Entry | ₹472 |
Stop-loss | ₹455 |
Planned risk per share | ₹17 |
First target | ₹512 |
Possible gain per share at that target | ₹40 |
The first target uses half the ₹80 pole: ₹472 + ₹40 = ₹512. For 100 shares, that is ₹1,700 of planned risk and ₹4,000 of possible gain at the first target, before charges and taxes. If the stock suddenly opens below ₹455, the loss could be greater than planned.
These made-up numbers explain the calculation. They should not be confused with the reported Hero MotoCorp levels or the Nifty chart.
Why traders use flags | What can go wrong |
The flag provides an area to watch instead of an impulse to act. | Price can break out and quickly return to the flag. |
Its opposite edge can help with exit planning. | A sudden price gap can lead to an exit at a worse price. |
The pole can help estimate a possible target. | That target may never be reached. |
The pattern can appear on stock and index charts. | Some shapes are open to interpretation, especially when the pause is long. |
A stop-loss is an order intended to close a trade when price moves against you. It helps you stick to a plan, but cannot guarantee an exact exit price during a sudden move.
There is also the risk of seeing what you want to see. Once you decide a chart is a flag, it can be tempting to ignore candles that no longer fit. Recheck the shape if the pause becomes too deep, lasts too long, or breaks the wrong way.
Question | Bullish flag | Bearish flag |
What happens first? | A sharp rise | A sharp fall |
How does the price pause? | Slightly down or sideways | Slightly up or sideways |
Which edge do traders watch? | Upper edge | Lower edge |
What move are they looking for? | A close above the pause | A close below the pause |
What might show the idea has failed? | Price returns into or below the pause | Price returns into or above the pause |
Flags are most useful to traders who follow charts and can make a plan for both an entry and an exit. A swing trader may study them on daily or weekly charts; an intraday trader may look for smaller versions during the trading day.
A long-term investor deciding whether to own a business for years may not need a short chart pattern.
A bullish flag begins with a rise; a bearish flag begins with a fall. In either case, the pause and the move out of it need to be visible before the label is useful. Hero MotoCorp offers a reported weekly bullish flag breakout, while your Nifty chart shows a bearish breakdown from a longer rising channel. They are different shapes, and it is worth saying so. Use patterns to organise what you see, check the chart behind any reported setup, and decide your risk before placing a trade.
It is a sharp price rise followed by a short, narrow pause that moves sideways or slightly down. Traders watch for a close above that pause.
It is a sharp fall followed by a short, narrow pause that moves sideways or slightly up. Traders watch for a close below it.
A flag has roughly parallel upper and lower edges. A pennant has edges that narrow towards each other.
They often look beyond the opposite edge of the flag for a level that would show their reading was wrong. The exact level depends on the chart, and the actual exit price can differ from the stop-loss price.
Beginners can practise identifying them on older charts. Trading them requires more: an exit plan, position sizing, and an understanding of the shares or contracts being traded.
Attention Investors!
Stock Brokers can accept securities as margin from clients only by way of pledge in the depository system w.e.f. September 1, 2020. Update your mobile number & email Id with your stock broker/depository participant and receive OTP directly from the depository on your email id and/or mobile number to create a pledge. Pay 20% upfront margin of the transaction early to trade in the cash market segment. Investors may please refer to the Exchange’s Frequently Asked Questions (FAQs) issued vide circular reference NSE/INSP/45191 dated July 31, 2020, and NSE/INSP/45534 dated August 31, 2020, and other guidelines issued from time to time in this regard. Check your Securities /MF/ Bonds in the consolidated account statement issued by NSDL/CDSL every month.
Corporate Office: No. 153/2, 3rd Floor, M.R.B.Arcade, Bagalur Main Road, Dwaraka Nagar, Yelahanka, Bengaluru – 560 063, Karnataka.
Registered Office: Old No.56/2 ,New No.58, LIC Nagar, Vinayagar Kovil Street, Erode -8,Tamil Nadu– 638002.
Alice Blue Financial Services (P) Ltd : NSE EQ | NSE FO | NSE CDS-90112 SEBI REG : INZ000156038
Alice Blue Financial Services (P) Ltd : BSE EQ | BSE FO | BSE CD-6670 SEBI REG : INZ000156038
Alice Blue Financial Services (P) Ltd : CDSL DP ID 12085300 DP SEBI REG : IN-DP-364-2018
Alice Blue Financial Services (P) Ltd : MCX-56710 SEBI REG : INZ000156038
We hereby declare that we are doing PRO trading
Procedure to file a complaint on SEBI SCORES : Register on SEBI SCORES 2.0. Mandatory details for filing complaints on SCORES: Name, PAN, Address, Mobile Number, E-mail ID. Benefits: Effective Communication, Speedy redressal of the grievances
Click on the provided link to learn about the process for submitting a complaint on the ODR platform for resolving investor grievances.
Investment in securities markets are subject to market risks, read all the related documents carefully before investing. Brokerage will not exceed SEBI prescribed limit.
For queries regarding account opening or activation, email to [email protected] and for fund updates, email to [email protected]
Disclaimer : Prevent unauthorized transactions in your account. Update your mobile numbers/email IDs with your stock brokers. Receive information of your transactions directly from Exchange on your mobile/email at the end of the day. Issued in the interest of investors. All clients have to update their email id and mobile number with Member : Investor Grievance [email protected]
KYC is a one time exercise while dealing in securities markets – once KYC is done through a SEBI registered intermediary (broker, DP, Mutual Fund etc.), you need not undergo the same process again when you approach another intermediary.
No need to issue cheques by investors while subscribing to an IPO. Just write the bank account number and sign in the application form to authorise your bank to make payment in case of allotment. No worries for refund as the money remains in the investor’s account.
Investors are requested to note that Alice Blue Financial Services Private Limited is permitted to receive money from investor through designated bank accounts only named as Up streaming Client Nodal Bank Account (USCNBA). Alice Blue Financial Services Private Limited is also required to disclose these USCNB accounts to Stock Exchange. Hence, you are requested to use following USCNB accounts only for the purpose of dealings in your trading account with us. The details of these USCNB accounts are also displayed by Stock Exchanges on their website under “Know/ Locate your Stock Broker. Bank Details (Valid UPI FAQ).


