
Most traders fail not because they lack indicators, but because they use too many without a clear strategy.
In this guide, we’ll break down the best indicators for swing trading, how they work, and how you can combine them to build a smarter and more consistent trading strategy.
Swing trading is a short-to-medium-term strategy where investors hold stocks or other financial assets for ‘several days to several weeks’ to capitalize on price “swings” or momentum.
Unlike day trading, these positions are held overnight, aiming to profit from anticipated price movements identified through technical analysis.
Markets are driven by emotions: fear, greed, speculation. Indicators help remove that emotional bias by giving you data-driven signals.
They help in:
Here are the most effective swing trading indicators and how to actually use them.
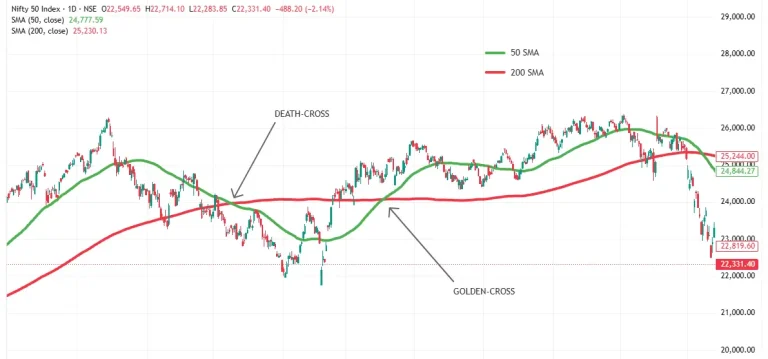
Best for: Identifying trend direction
Moving averages smooth out price data to show the overall trend.
50-day SMA + 200-day SMA → This pair is considered one of the most reliable for Indian markets.
Trading Style | Best SMA Periods | Primary Use in the Indian Market | Example Strategy |
Intraday / Day Trading | 5, 8, 13 or 9-20 period (on 5/15-min charts) | Quick momentum, entry/exit in volatile sessions (e.g., Bank Nifty) | 5-8-13 SMA combo for trend shifts |
Swing Trading | 20-50 days | Medium-term swings (a few days to weeks) | 20/50 crossover |
Positional / Investment | 50-day + 200-day (most popular) | Long-term trend & major reversals (Nifty, Sensex, blue-chips) | Golden/Death Cross |
Long-term Investing | 100-200 days | Major market bias & portfolio decisions | Price above 200-day SMA = stay invested |
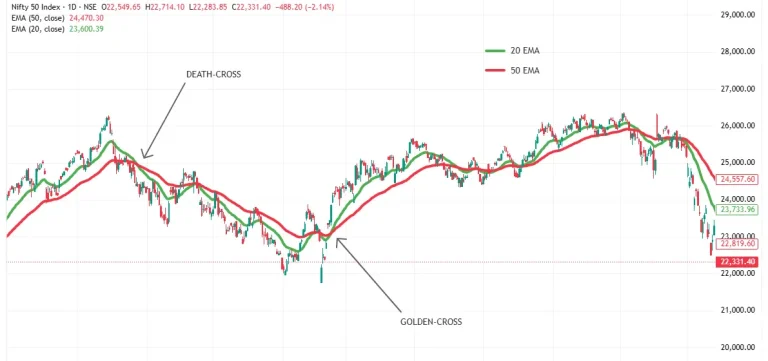
20 EMA → Your “fast lane” for entries/exits.
50 EMA → The single most reliable trend filter for swing traders in India.
200 EMA → Long-term anchor (use with 50 EMA for Golden Cross).
Many professional traders use a 20/50 EMA crossover on daily charts for swing trades (price above both + 20 crossing above 50 = strong buy)
Why it works:
Swing trading depends heavily on trend direction. Moving averages help you stay on the right side of the market.
How to use it:
Best settings:
Trading Style | Best EMA Periods | Primary Use in the Indian Market | Why Traders Love It |
Short-term Swing (2–5 days) | 9 & 21 EMA or 20 EMA | Quick momentum entries on Nifty/Bank Nifty | Fastest signals, great for pullback buys |
Core Swing Trading (5–15 days) | 20 EMA + 50 EMA (most popular combo) | Medium-term trend + entry timing | 50 EMA is the “sweet spot” for Indian swings |
Positional / Medium-term | 50 EMA + 200 EMA | Major trend filter & Golden/Death Cross | 50 EMA = institutional trend; 200 EMA = big-picture bias |
Long-term Investing | 100 EMA or 200 EMA | Overall market health (Nifty above 200 EMA = stay invested) | Filters out noise during corrections |
Feature | SMA (Simple Moving Average) | EMA (Exponential Moving Average) |
Calculation | Equal weight to all prices in the period (Just add closing prices and divide by the number of days) | More weight to recent prices (exponential decay). Formula: EMA = (Close × multiplier) + (Previous EMA × (1 – multiplier)) Multiplier = 2 / (Period + 1) |
Responsiveness | Slower / more lag | Faster / less lag |
How it looks on the chart | Smoother line, farther from the current price | Sticks closer to price action |
Best for | Long-term trend confirmation, fewer false signals | Short-to-medium term trading, quicker signals |
Drawback | Can miss early trend changes | More whipsaws (false signals) in choppy markets |
Indian trader preference | Traditional & stable (especially 200-day) | Preferred by most active traders |
Many traders prefer EMA over SMA because it reacts faster to price changes, making it best for swing trading.
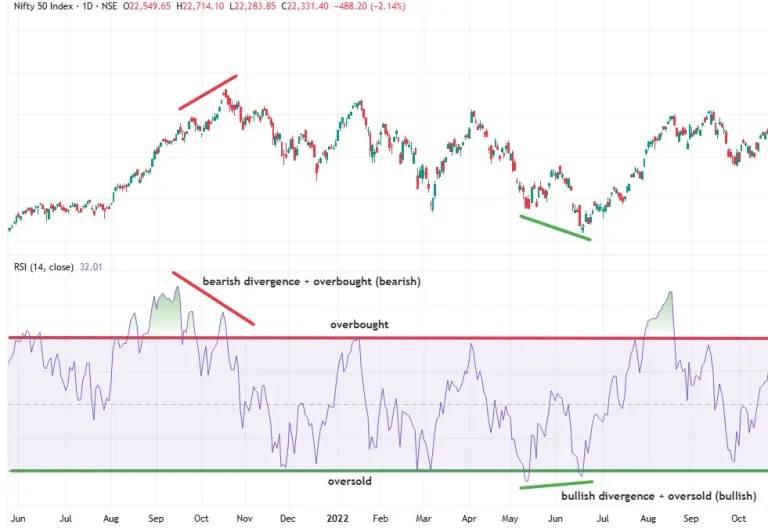
Best for: Identifying overbought and oversold conditions. It tells when a stock is overbought (time to sell) or oversold (time to buy).
RSI is a momentum indicator that ranges from 0 to 100.
Why it works:
Markets often pull back after extreme moves. RSI helps spot those turning points.
How to use it:
Best setting:
14-period, levels 30/70
Don’t use RSI alone; combine it with trend indicators like moving averages for better accuracy.
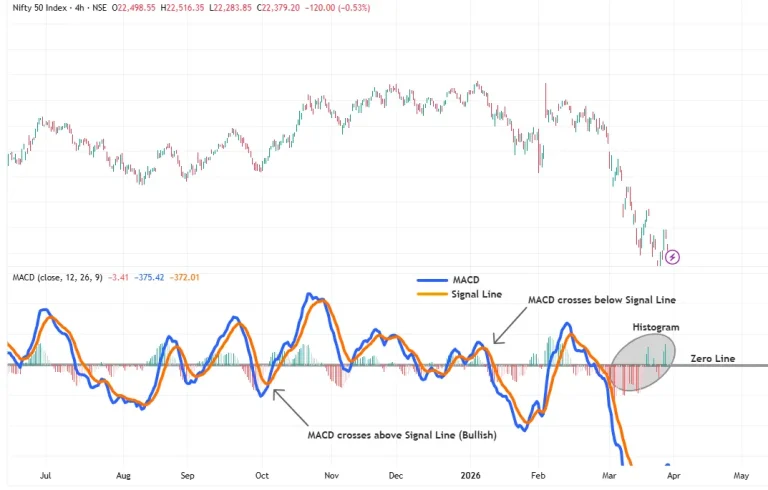
Best for: Trend confirmation and momentum
MACD shows the relationship between two moving averages, shows momentum shifts, and trend strengths.
Components:
Default settings:
12, 26, 9
These work perfectly on daily charts, and for swing trading Nifty 50, Bank Nifty, and liquid stocks.
Best Ways to Use MACD in Indian Stocks:
Signal Type | What to Look For | Action in the Indian Market | Reliability |
MACD Line Crossover | MACD crosses above Signal Line | Bullish → Buy swing (long) | High |
MACD Line Crossover | MACD crosses below Signal Line | Bearish → Exit or short bias | High |
Histogram Flip | Histogram turns positive (green bars growing) | Momentum building → Strong buy | Very High |
Histogram Flip | Histogram turns negative (red bars growing) | Momentum fading → Exit | Very High |
Zero Line Cross | MACD crosses above 0 | Strong uptrend confirmation | High |
Zero Line Cross | MACD crosses below 0 | Strong downtrend confirmation | High |
MACD works best in trending markets.
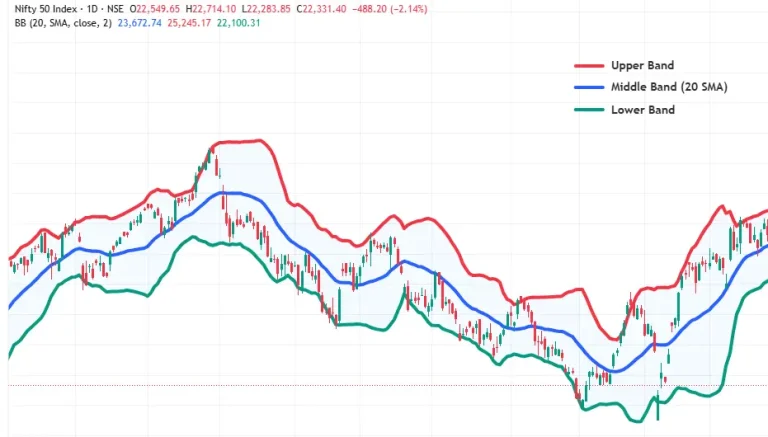
Best for: Volatility and breakout signals
Components:
How to use it:
Why it works:
It adapts to market volatility, helping traders spot breakouts and reversals.
A Bollinger Band squeeze often signals a big move coming.
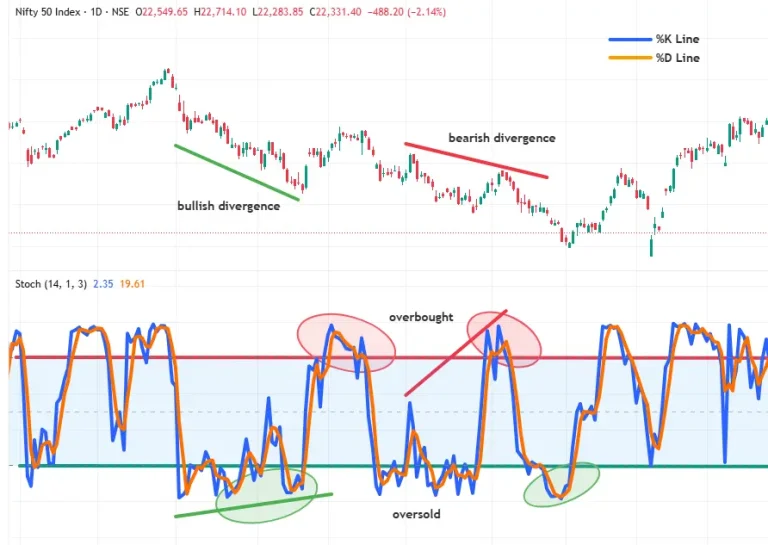
Best for: Spotting reversals early
Like RSI, it ranges from 0 to 100.
Why it works:
It reacts faster than RSI, making it useful for early signals.
Best for: Confirming trends
Volume shows how strong a price move really is.
Key insights:
Why it works:
Price moves without volume often fail; volume adds confirmation.
Always check volume before entering a trade.
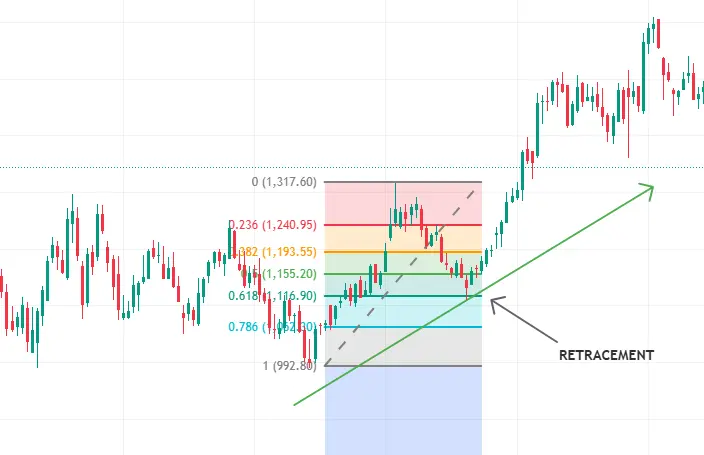
Best for: Support and resistance levels
Fibonacci levels include:
23.6%, 38.2%, 50%, 61.8% (golden ratio), 78.6%
How to use it:
Why it works:
Markets often retrace before continuing trends; these levels act as psychological zones.
The 61.8% is especially important for strong reversals.
Using a single indicator is risky. Combining them improves accuracy.
Even with the best indicators, traders often fail due to simple mistakes:
The key takeaway is simple: less is more. Instead of cluttering your charts with too many indicators, focus on 2-3 that complement each other.
For example, combining a trend indicator (like 20/50 EMA) with a momentum tool (like RSI or MACD) can significantly improve your decision-making.
Remember, no indicator is 100% accurate. Market conditions change, and even the best setups can fail. That’s why risk management, patience, and consistency matter more than any single signal. Always use stop-losses, follow a favorable risk-reward ratio, and avoid emotional trading.
To effectively apply these strategies, using a reliable trading platform can help streamline chart analysis and execution. Platforms like Alice Blue ANT offer tools that support indicator-based trading, allowing you to test and refine your approach in real market conditions.
A Golden Cross is a long-term signal, while a 70+ RSI is a short-term warning. In this scenario, you should wait for a “throwback.” Let the price break out, then wait for it to return and test the 50-day SMA as new support. Entering at RSI 70 often leads to getting stopped out by a minor correction before the actual move begins.
Indicators rely on high liquidity and “crowd psychology.” In large-cap stocks, millions of people (and algos) are watching the same 200 EMA. Small-cap or “penny‘ stocks are easily manipulated by a few large orders, which can “break” the indicator’s logic. For small-caps, prioritize volume over oscillators like RSI.
Indicators such as MACD and 50 EMA are far more reliable on daily or 4-hour charts. On a 1-minute chart, you will see dozens of “false” crossovers per hour. If you want to trade shorter timeframes, you must shorten your indicator periods (use a 9 EMA instead of a 20 EMA)
In a powerful downtrend, RSI can stay “oversold” (below 30) for weeks while the price crashes another 20-30%. The solution is to never buy just because the RSI is low. Wait for a bullish divergence or for the price to reclaim a moving average (like the 9 EMA) to prove that momentum is actually shifting back up.
For most retail traders, holding 3 to 5 positions is the “sweet spot.” It’s enough to spread risk, but few enough that you can closely monitor the news and price action for each.
Swing trades typically use daily charts as the primary time frame, with weekly charts for broader trend context. The recommended periods are 20/50 EMA, 14-period RSI, and 12/26/9 MACD, which are optimized for daily charts. Shorter intraday charts (5/15-min) suit quicker swings.
Most active Indian swing traders prefer EMA (especially 20 and 50-period) because it reacts faster to recent price changes and provides quicker entry/exit signals with less lag. SMA (particularly 50/200-day) is better for long-term trend confirmation and fewer false signals, such as Golden/Death Crosses on Nifty or Sensex. Many combine both: EMA for timing and SMA for overall bias.
Yes, the same indicators (especially, 20/50 EMA crossovers, MACD histogram flips, and Bollinger Band squeezes) work well on Nifty and bank Nifty for swing trades. The blog highlights their popularity for these indices on daily charts. Volume confirmation becomes even more important in derivatives due to high volatility.
Attention Investors!
Stock Brokers can accept securities as margin from clients only by way of pledge in the depository system w.e.f. September 1, 2020. Update your mobile number & email Id with your stock broker/depository participant and receive OTP directly from the depository on your email id and/or mobile number to create a pledge. Pay 20% upfront margin of the transaction early to trade in the cash market segment. Investors may please refer to the Exchange’s Frequently Asked Questions (FAQs) issued vide circular reference NSE/INSP/45191 dated July 31, 2020, and NSE/INSP/45534 dated August 31, 2020, and other guidelines issued from time to time in this regard. Check your Securities /MF/ Bonds in the consolidated account statement issued by NSDL/CDSL every month.
Corporate Office: No. 153/2, 3rd Floor, M.R.B.Arcade, Bagalur Main Road, Dwaraka Nagar, Yelahanka, Bengaluru – 560 063, Karnataka.
Registered Office: Old No.56/2 ,New No.58, LIC Nagar, Vinayagar Kovil Street, Erode -8,Tamil Nadu– 638002.
Alice Blue Financial Services (P) Ltd : NSE EQ | NSE FO | NSE CDS-90112 SEBI REG : INZ000156038
Alice Blue Financial Services (P) Ltd : BSE EQ | BSE FO | BSE CD-6670 SEBI REG : INZ000156038
Alice Blue Financial Services (P) Ltd : CDSL DP ID 12085300 DP SEBI REG : IN-DP-364-2018
Alice Blue Financial Services (P) Ltd : MCX-56710 SEBI REG : INZ000156038
We hereby declare that we are doing PRO trading
Procedure to file a complaint on SEBI SCORES : Register on SEBI SCORES 2.0. Mandatory details for filing complaints on SCORES: Name, PAN, Address, Mobile Number, E-mail ID. Benefits: Effective Communication, Speedy redressal of the grievances
Click on the provided link to learn about the process for submitting a complaint on the ODR platform for resolving investor grievances.
Investment in securities markets are subject to market risks, read all the related documents carefully before investing. Brokerage will not exceed SEBI prescribed limit.
For queries regarding account opening or activation, email to [email protected] and for fund updates, email to [email protected]
Disclaimer : Prevent unauthorized transactions in your account. Update your mobile numbers/email IDs with your stock brokers. Receive information of your transactions directly from Exchange on your mobile/email at the end of the day. Issued in the interest of investors. All clients have to update their email id and mobile number with Member : Investor Grievance [email protected]
KYC is a one time exercise while dealing in securities markets – once KYC is done through a SEBI registered intermediary (broker, DP, Mutual Fund etc.), you need not undergo the same process again when you approach another intermediary.
No need to issue cheques by investors while subscribing to an IPO. Just write the bank account number and sign in the application form to authorise your bank to make payment in case of allotment. No worries for refund as the money remains in the investor’s account.
Investors are requested to note that Alice Blue Financial Services Private Limited is permitted to receive money from investor through designated bank accounts only named as Up streaming Client Nodal Bank Account (USCNBA). Alice Blue Financial Services Private Limited is also required to disclose these USCNB accounts to Stock Exchange. Hence, you are requested to use following USCNB accounts only for the purpose of dealings in your trading account with us. The details of these USCNB accounts are also displayed by Stock Exchanges on their website under “Know/ Locate your Stock Broker. Bank Details (Valid UPI FAQ).


