
An abandoned baby pattern is a three-candle reversal formation in which a central Doji candle is completely isolated from the candles on either side by price gaps, including the wicks.
It appears at market tops and bottoms and signals a sharp, high-conviction shift in momentum. The middle candle looks literally abandoned on the chart – suspended in space with no price contact on either side.
There are two versions:
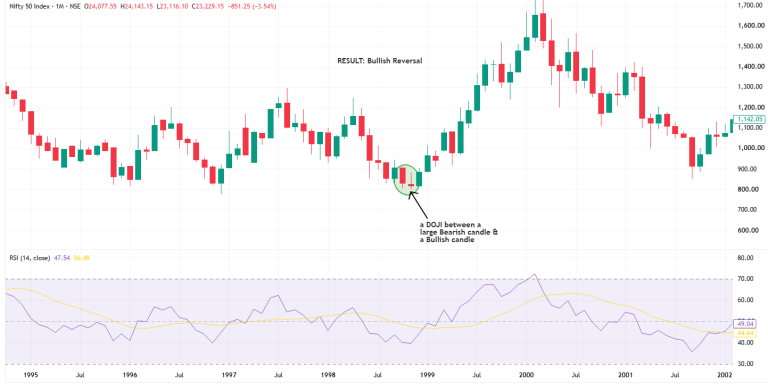
Example above: We take a look at the Nifty 50 Index between the years 1995 and 2002, where a clear Bullish Doji appeared.
Interpretation: It can indicate that selling pressure is weakening and buyers may be taking control.
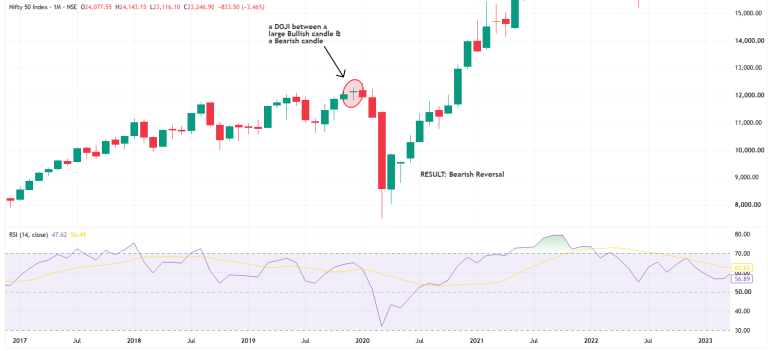
Example above: We take a look at the Nifty 50 Index between the years 2017 and 2023, where a clear Bearish doji appeared.
Interpretation: It can indicate that buying pressure is weakening and sellers may be taking control.
Since the Doji is the key candle in this formation, understanding how a Doji candlestick works can help you identify the pattern more accurately.
Also, like other candlestick patterns, it doesn’t guarantee a reversal. Traders often look for confirmation from the next candle, volume, support/resistance, or indicators.
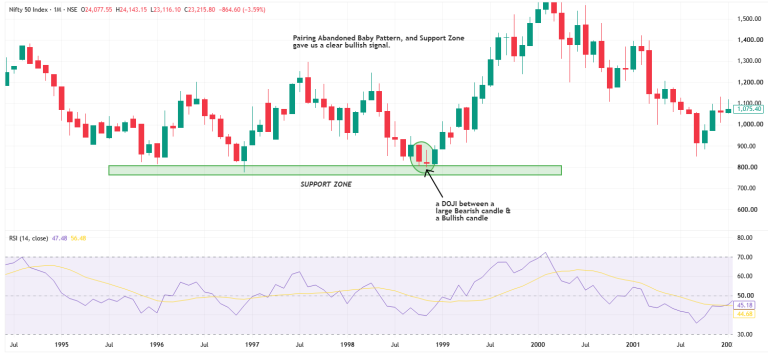
For example, for the Bullish Abandoned Baby example above, if we go deeper, we see a resistance zone at the price range ₹770-₹810, and combining it with the Abandoned Baby Pattern, the potential for the reversal was even stronger.
Understanding support and resistance can also help traders put candlestick patterns into the context of important price levels.
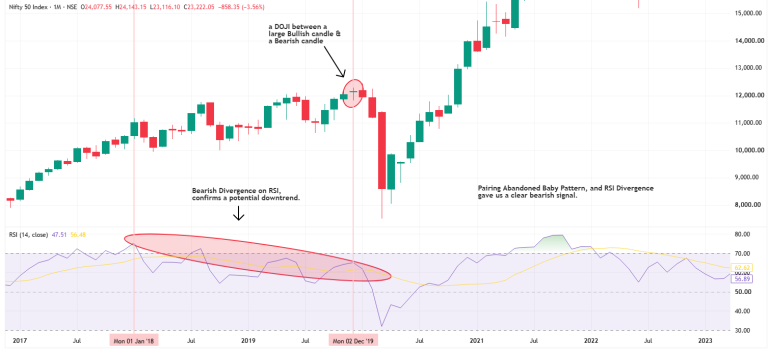
For example, for the Bearish Abandoned Baby example above, if we go deeper, we see a continuous RSI divergence while the price keeps rising (price making higher highs, making it a textbook RSI divergence) from the price range of ₹11,000 to all the way to ₹12,300.
And combining it with the Abandoned Baby Pattern, the potential for the reversal was even stronger.
And this is how Traders make use of multiple patterns and indicators to confirm a trend reversal.
RSI is another commonly used tool for analysing momentum and spotting possible divergence alongside price action.
Pattern | Usually appears after | Possible signal |
Bullish Abandoned Baby | Downtrend | Potential bullish reversal |
Bearish Abandoned Baby | Uptrend | Potential bearish reversal |
The formation isn’t arbitrary. Each of the three candles represents a distinct psychological phase in the market’s transition from one dominant group to another.
Step 1 – Identify the Existing Trend: A large, directional candle forms in the direction of the ongoing trend. In an uptrend, this is a strong green candle closing near its high. In a downtrend, it’s a strong red candle closing near its low. The trend is clearly intact at this point.
Step 2 – Look for the Isolated Doji. The next session opens with a gap continuing the trend direction – initially appearing to confirm momentum. But the session goes nowhere. Neither buyers nor sellers can push price further. The candle closes at or near its open, forming a Doji. Critically, both the wicks of this Doji and the wicks of the first candle have no price overlap – there is a genuine gap in space between them.
Step 3 – Check the Second Price Gap: The following session opens in the opposite direction, gapping away from the Doji rather than continuing the trend. Strong opposing-side orders drive price aggressively into the body of the first candle.
Step 4 – Confirm the Abandoned Baby Pattern: The third candle closes, completely isolating the Doji on both sides by price gaps. The pattern is confirmed. No wicks touch the Doji from either the first or third candle. This strict gap requirement is what separates the abandoned baby from lookalike patterns and gives it its elevated reliability.
A blue-chip stock is trading around ₹3,000 in a clear uptrend.
Day 1: The stock surges and closes at ₹3,020 – a large, confident green candle.
Day 2: The stock gaps up on the open to ₹3,050. Through the session, it oscillates between ₹3,040 and ₹3,060 without conviction in either direction, finally closing at ₹3,050. A Doji – completely isolated above the Day 1 candle with no wick contact.
Day 3: Negative sentiment causes a gap down to ₹3,010 at the open. Sellers pile in and drive the close down to ₹2,950 – well into the body of Day 1’s candle.
This is a bearish abandoned baby. The trade setup: short entry at the close of Day 3 at ₹2,950, stop-loss placed just above the Doji’s high at ₹3,060, and take-profit target at a key support level near ₹2,800. The risk is approximately ₹110 per share. The potential reward is approximately ₹150. A clean 1:1.36 risk-to-reward ratio on a high-conviction reversal signal.
Traders frequently confuse these patterns. The visual similarity is real – all three involve a small middle candle flanked by two larger candles. But the technical requirements differ significantly.
Feature | Abandoned Baby | Morning/Evening Star |
Middle Candle | Strict Doji – open and close nearly identical | Small real body – can be a spinning top or Doji |
Gap Requirement | Mandatory double gaps including wicks | Optional – bodies often overlap |
Frequency | Very rare | Moderate |
Signal Strength | Extremely high | Moderate to high |
Market Context | Abrupt exhaustion and sharp reversal | Gradual shift in control |
The Morning Star and Evening Star are useful patterns with real predictive value. But when you need a high-conviction reversal signal with a precise stop-loss location and minimal ambiguity about what the market is telling you, the abandoned baby, when it appears, is the stronger signal.
The abandoned baby pattern rewards patience and precision equally. Its strict formation requirements – genuine double gaps surrounding an isolated Doji, including the wicks – make it uncommon on most charts and most markets. But those same requirements are exactly what give it the elevated reliability that looser patterns can’t match.
When you see a genuine abandoned baby on a daily stock chart, with volume confirmation on the third candle and RSI context supporting the reversal, you’re looking at one of the higher-probability setups in technical analysis. Wait for it, trade it correctly with a proper stop-loss, and the risk-to-reward profile of the resulting trade will consistently justify the patience it required.
Historical backtesting shows accuracy rates between 70 and 77% when correctly identified on daily stock charts with volume confirmation. The strict formation requirements – particularly the mandatory wick gaps – are what produce this elevated accuracy compared to more loosely defined reversal patterns. Accuracy drops significantly on intraday charts where genuine gaps are less common.
A bullish abandoned baby forms at the bottom of a downtrend – the first candle is a strong red candle, the Doji is isolated below it by gaps, and the third candle is a strong green candle that gaps up and closes into the first candle’s body. This signals an upward reversal. The bearish version is the mirror image, forming at uptrend tops and signalling a downward reversal. The trading rules are identical – only the direction changes.
It requires two consecutive price gaps on both sides of a Doji candle, including the wicks. In liquid equity markets, overnight gaps between candle wicks happen occasionally but not frequently. When they occur on both sides of the same Doji in sequence, the formation is complete – and that specific combination of circumstances is genuinely uncommon.
The daily chart is the most reliable for two reasons: overnight equity market sessions naturally create the price gaps the pattern requires, and daily candles filter out the noise that produces false signals on lower timeframes. The 4-hour chart can work for capturing similar setups around major session opens. Anything below the 4-hour produces too many gap-like formations that don’t reflect genuine market-wide sentiment shifts.
Measure the vertical distance from the extreme wick of the Doji to the closing price of the third candle. Project that distance from your entry point for a 1:1 minimum target. For a higher reward-to-risk setup, identify the nearest major support level (for bearish setups) or resistance level (for bullish setups) and set the target there – provided the resulting ratio is at least 1:2.
Yes, this is the double Doji variant. When two consecutive Doji candles appear in the gap zone before the third candle completes the setup, the reversal logic remains valid as long as both Dojis are completely isolated by gaps on both sides with no wick contact from the first or third candle. The trading rules apply identically.
Don’t chase it. If the gap on the third candle is large enough that your stop above the Doji’s wick produces a risk-to-reward ratio below 1:1.5, either wait for a minor intraday pullback toward the third candle’s open to improve the entry price – or pass on the trade entirely. Maintaining discipline about minimum risk-to-reward requirements is more important than any single setup.
Two filters improve reliability significantly. First, volume on the third confirmation candle should be at least 20 to 50% above the 20-period average – confirming institutional participation rather than thin-volume noise. Second, check RSI positioning – a bearish pattern forming above 70 or a bullish pattern forming below 30 has meaningfully higher historical reliability than the same setup in neutral RSI territory.
Rarely – and with lower reliability than on daily charts. True price gaps rarely occur during continuous intraday sessions on equity markets. On 5-minute or 15-minute charts, what appears to be a gap is often just a candle boundary where the next candle opens at the prior close. The 4-hour chart around major session opens (like the market open gap) can produce valid formations, but the daily chart remains the most reliable timeframe by a meaningful margin.
Attention Investors!
Stock Brokers can accept securities as margin from clients only by way of pledge in the depository system w.e.f. September 1, 2020. Update your mobile number & email Id with your stock broker/depository participant and receive OTP directly from the depository on your email id and/or mobile number to create a pledge. Pay 20% upfront margin of the transaction early to trade in the cash market segment. Investors may please refer to the Exchange’s Frequently Asked Questions (FAQs) issued vide circular reference NSE/INSP/45191 dated July 31, 2020, and NSE/INSP/45534 dated August 31, 2020, and other guidelines issued from time to time in this regard. Check your Securities /MF/ Bonds in the consolidated account statement issued by NSDL/CDSL every month.
Corporate Office: No. 153/2, 3rd Floor, M.R.B.Arcade, Bagalur Main Road, Dwaraka Nagar, Yelahanka, Bengaluru – 560 063, Karnataka.
Registered Office: Old No.56/2 ,New No.58, LIC Nagar, Vinayagar Kovil Street, Erode -8,Tamil Nadu– 638002.
Alice Blue Financial Services (P) Ltd : NSE EQ | NSE FO | NSE CDS-90112 SEBI REG : INZ000156038
Alice Blue Financial Services (P) Ltd : BSE EQ | BSE FO | BSE CD-6670 SEBI REG : INZ000156038
Alice Blue Financial Services (P) Ltd : CDSL DP ID 12085300 DP SEBI REG : IN-DP-364-2018
Alice Blue Financial Services (P) Ltd : MCX-56710 SEBI REG : INZ000156038
We hereby declare that we are doing PRO trading
Procedure to file a complaint on SEBI SCORES : Register on SEBI SCORES 2.0. Mandatory details for filing complaints on SCORES: Name, PAN, Address, Mobile Number, E-mail ID. Benefits: Effective Communication, Speedy redressal of the grievances
Click on the provided link to learn about the process for submitting a complaint on the ODR platform for resolving investor grievances.
Investment in securities markets are subject to market risks, read all the related documents carefully before investing. Brokerage will not exceed SEBI prescribed limit.
For queries regarding account opening or activation, email to [email protected] and for fund updates, email to [email protected]
Disclaimer : Prevent unauthorized transactions in your account. Update your mobile numbers/email IDs with your stock brokers. Receive information of your transactions directly from Exchange on your mobile/email at the end of the day. Issued in the interest of investors. All clients have to update their email id and mobile number with Member : Investor Grievance [email protected]
KYC is a one time exercise while dealing in securities markets – once KYC is done through a SEBI registered intermediary (broker, DP, Mutual Fund etc.), you need not undergo the same process again when you approach another intermediary.
No need to issue cheques by investors while subscribing to an IPO. Just write the bank account number and sign in the application form to authorise your bank to make payment in case of allotment. No worries for refund as the money remains in the investor’s account.
Investors are requested to note that Alice Blue Financial Services Private Limited is permitted to receive money from investor through designated bank accounts only named as Up streaming Client Nodal Bank Account (USCNBA). Alice Blue Financial Services Private Limited is also required to disclose these USCNB accounts to Stock Exchange. Hence, you are requested to use following USCNB accounts only for the purpose of dealings in your trading account with us. The details of these USCNB accounts are also displayed by Stock Exchanges on their website under “Know/ Locate your Stock Broker. Bank Details (Valid UPI FAQ).


