
A Displaced Moving Average (DMA) is a standard moving average shifted forward or backwards in time to project smoother, predictive support and resistance levels. In Indian stock trading, shifting the 50 and 200 DMAs forward helps reduce lagging false signals during volatile market sessions.
This guide explains how to use displaced moving average settings (specifically the 50 DMA and 200 DMA) to track market cycles accurately and improve your trading execution across the Indian stock market.
In Indian trading forums, most retail investors casually use the acronym “DMA” to mean Daily Moving Average. However, structural market professionals use it to describe a Displaced Moving Average.
A moving average typically calculates the average closing price of a stock and plots it directly under the latest trading candle. A displaced moving average takes that same calculation but physically moves the entire indicator line forward into the future or backwards into the past by a specific number of periods.
For Indian equities, traders focus almost entirely on forward displacement. By moving the line to the right of the current price action, you create a visual reference that prevents normal daily price fluctuations from prematurely triggering your stop-losses.
Executing a 50 DMA and 200 DMA trading strategy follows a strict, logical sequence on your charting terminal:
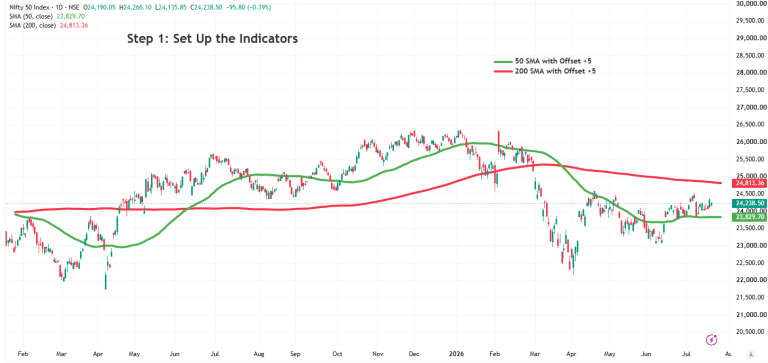
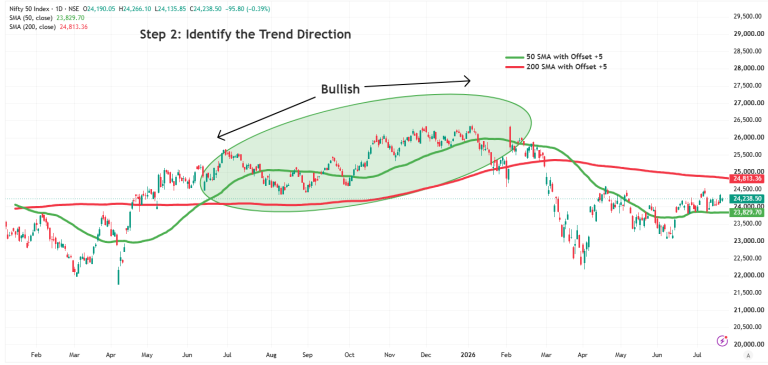
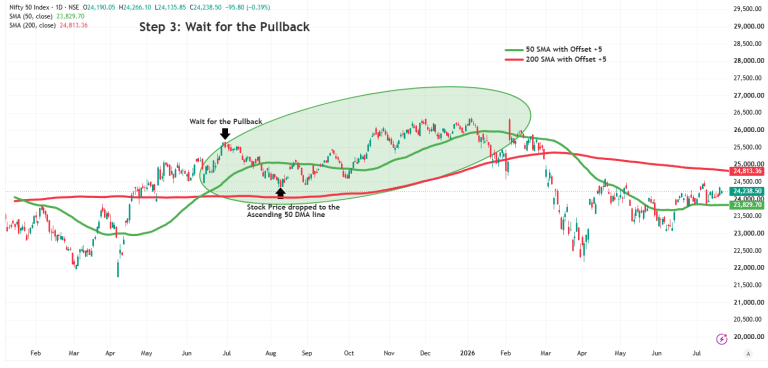
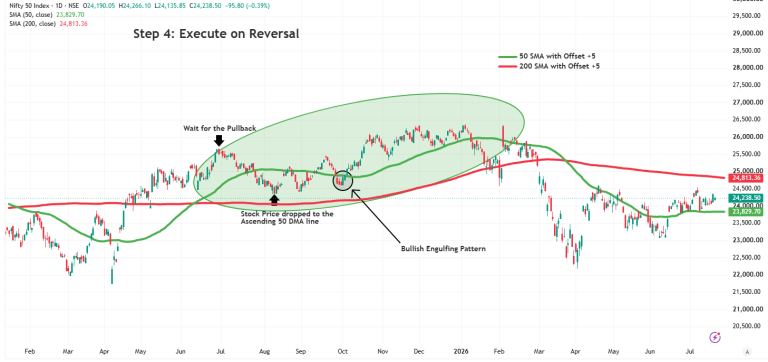
Let us look at a realistic scenario involving a liquid large-cap stock like Reliance Industries on the NSE:
Using a DMA trading strategy indian market framework can help traders analyse trends more consistently:
During sideways markets, traders may find additional indicators such as RSI useful for judging whether momentum is actually building behind a move.
Timeframe | Suggested Offset |
Daily | 3-5 |
Weekly | 1-2 |
15 Minute | 1-2 |
5 Minute | 1 |
Evaluation Criteria | Simple Moving Average (SMA) | Displaced Moving Average (DMA) |
Reaction Timing | Tied directly to the chronological close of the current day. | Projecting forward into the future to create a buffer. |
False Signal Prevention | Low; easily pierced by sharp, short-lived intraday market spikes. | High; the time-shift naturally absorbs volatile market noise. |
Visual Position | Sits directly under or through the current price candles. | Shifted to the right side of the active price chart. |
Best Used For | Basic, macro trend identification. | Pinpointing entry pullbacks and trailing active stop-losses. |
A moving-average crossover should be considered in the context of the broader trend, as a crossover alone does not guarantee that prices will continue in the same direction.
Learning how to trade indian stocks using 50 and 200 DMA frameworks helps traders view market trends from a different perspective.
By incorporating a forward-shifted displacement buffer, you may reduce the lagging traps that standard indicators present to retail investors.
Implement these settings on your layout, and study historical charts to improve decision-making when combined with proper risk management.
The 50 DMA is far superior for active swing trading as it tracks intermediate momentum over a two-month cycle. The 200 DMA should be used purely as a macro filter to confirm that you are not buying a stock stuck in a long-term bear market.
For daily charts, an offset or displacement setting between +3 and +5 works best. This provides enough of a forward buffer to filter out routine market volatility without making the indicator line lag too far behind the real-time stock price.
Yes, you can apply it to intraday trading by dropping your time frame down to a 5-minute or 15-minute chart. However, you must keep the displacement values tighter (around +2) to ensure the system adapts fast enough to quick intraday trend reversals.
Yes, but since overnight short selling of cash shares is restricted in India, you may enter short setups using Stock Futures or Options when the price rallies up to a declining 50 DMA.
Hold the trade if your structural stop-loss isn’t hit, as institutions often accumulate in the zone between the two lines. Avoid adding fresh capital until the price closes back above the 50 DMA.
Yes. Displacing an EMA creates a line that reacts faster to sudden price shocks, making it highly effective for volatile, high-beta sectors like Nifty IT or Public Sector Banks.
A forward displacement (like +5) shifts the line 5 days into the future, leaving the most recent candles open. Trade by observing how today’s price interacts with the line projected from previous sessions.
Attention Investors!
Stock Brokers can accept securities as margin from clients only by way of pledge in the depository system w.e.f. September 1, 2020. Update your mobile number & email Id with your stock broker/depository participant and receive OTP directly from the depository on your email id and/or mobile number to create a pledge. Pay 20% upfront margin of the transaction early to trade in the cash market segment. Investors may please refer to the Exchange’s Frequently Asked Questions (FAQs) issued vide circular reference NSE/INSP/45191 dated July 31, 2020, and NSE/INSP/45534 dated August 31, 2020, and other guidelines issued from time to time in this regard. Check your Securities /MF/ Bonds in the consolidated account statement issued by NSDL/CDSL every month.
Corporate Office: No. 153/2, 3rd Floor, M.R.B.Arcade, Bagalur Main Road, Dwaraka Nagar, Yelahanka, Bengaluru – 560 063, Karnataka.
Registered Office: Old No.56/2 ,New No.58, LIC Nagar, Vinayagar Kovil Street, Erode -8,Tamil Nadu– 638002.
Alice Blue Financial Services (P) Ltd : NSE EQ | NSE FO | NSE CDS-90112 SEBI REG : INZ000156038
Alice Blue Financial Services (P) Ltd : BSE EQ | BSE FO | BSE CD-6670 SEBI REG : INZ000156038
Alice Blue Financial Services (P) Ltd : CDSL DP ID 12085300 DP SEBI REG : IN-DP-364-2018
Alice Blue Financial Services (P) Ltd : MCX-56710 SEBI REG : INZ000156038
We hereby declare that we are doing PRO trading
Procedure to file a complaint on SEBI SCORES : Register on SEBI SCORES 2.0. Mandatory details for filing complaints on SCORES: Name, PAN, Address, Mobile Number, E-mail ID. Benefits: Effective Communication, Speedy redressal of the grievances
Click on the provided link to learn about the process for submitting a complaint on the ODR platform for resolving investor grievances.
Investment in securities markets are subject to market risks, read all the related documents carefully before investing. Brokerage will not exceed SEBI prescribed limit.
For queries regarding account opening or activation, email to [email protected] and for fund updates, email to [email protected]
Disclaimer : Prevent unauthorized transactions in your account. Update your mobile numbers/email IDs with your stock brokers. Receive information of your transactions directly from Exchange on your mobile/email at the end of the day. Issued in the interest of investors. All clients have to update their email id and mobile number with Member : Investor Grievance [email protected]
KYC is a one time exercise while dealing in securities markets – once KYC is done through a SEBI registered intermediary (broker, DP, Mutual Fund etc.), you need not undergo the same process again when you approach another intermediary.
No need to issue cheques by investors while subscribing to an IPO. Just write the bank account number and sign in the application form to authorise your bank to make payment in case of allotment. No worries for refund as the money remains in the investor’s account.
Investors are requested to note that Alice Blue Financial Services Private Limited is permitted to receive money from investor through designated bank accounts only named as Up streaming Client Nodal Bank Account (USCNBA). Alice Blue Financial Services Private Limited is also required to disclose these USCNB accounts to Stock Exchange. Hence, you are requested to use following USCNB accounts only for the purpose of dealings in your trading account with us. The details of these USCNB accounts are also displayed by Stock Exchanges on their website under “Know/ Locate your Stock Broker. Bank Details (Valid UPI FAQ).


